We’re proud to announce Vyopta has officially launched a lean, mean video collaboration, monitoring and improvement machine with our long-time partner, Vidyo. This new product completes the fifth integration of Vyopta’s vAnalytics product. vAnalytics has allowed businesses to troubleshoot their video collaboration tools in real-time, monitor performance, and optimize multiple video and web conferencing solutions at once. 
Now, Vidyo is part of our robust, low bandwidth, direct and multiparty video conferencing analytics tool. Our users have a better picture of who is using (or not using) each of their video conferencing tools, how each tool has performed historically, how to improve the quality of user experience, and how each solution is adding value to their business.
Vidyo’s Infrastructure
Vidyo is one of the more popular collaboration options in the telemedicine and banking industries. They serve clients like Mayo Clinic and AIG. They have grown their name by offering low bandwidth, high reliability and the flexibility needed for companies to develop on top of its core technology to meet specific business needs.
Vidyo deployments typically include;
- VidyoRouters: Virtualized bridging servers directing a well-optimized video stream to each video conferencing participant.
- VidyoGateways: Transcoding and firewall traversal gateways used when extending the infrastructure to third-party video and audio endpoints.
- VidyoPortal: Set of management tools accessible through a simple, browser-based interface.
The tool is typically accessed through hardware endpoints called VidyoRooms and software endpoints called VidyoDesktop which includes; iPhones, Android phones, WebRTC, and (you guessed it) laptops. Pretty cool stuff.
Integrating Vidyo with Other Technologies
With any new technology implementation, there are always challenges with replacing the old during that awkward transition period. For example, if you have a large Cisco network and you add a Vidyo deployment, the two systems do not have any shared error log or usage tracking area to help diagnose interoperability problems. Reporting and troubleshooting on these two video systems has to be done completely separately.
This is where Vyopta comes in. Vyopta’s vAnalytics product incorporates Vidyo’s usage, performance, and capacity data into our Historical Analytics tool alongside all other vendors. Customers can now drive adoption, improve quality of experience, and optimize their resources and investments for all video conferencing from a single tool.
The most common barriers to adoption are overcoming user discomfort, improving quality of experience and making sure you have all the right resources. vAnalytics will provide actionable insights for each of these common friction points for each of your video conferencing solutions, and now — Vidyo.
1. Driving User Adoption
vAnalytics allows vidyo users you to target those users who either lack training or information about how video conferencing can benefit their day-to-day activities. It also provides administrators with information about;
- Installations
- Users
- Minutes
- Meetings
This will help your business pinpoint who has installed, hosted, attended, and successfully completed meetings. It will also uncover who has not completed these items.
In the example below, the Client Installation Trend Chart (left) indicates growth in installations of VidyoDesktop. Growth has remained steady for the past year, with a key adoption event in October of 2015 producing an inflection point. In order to better ramp adoption, you now have the insight that you should explore the activities implemented October. Perhaps you can revisit them for another adoption spike.
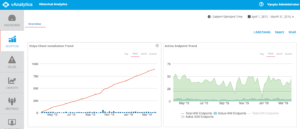
However, there is often a better story when you have multiple data points. The Active Endpoint Trend Chart (right) shows that although there have been more installations, we do not see growth in weekly active users. Active users is a much better metric for adoption, in our opinion. Neither hardware nor software endpoints users are growing, so you can tell that more installation does not equal more adoption. Digging into this data can help determine which specifically which endpoints are being used and which are not. From there, you can formulate a gameplan and either train inactive users or create a program to reach out to people who have recently gone through an install to find out why they aren’t taking the next step.
2. Improving Call Quality
One of the biggest advantages of the partnership between Vidyo and Vyopta is vAnalytics’s ability to analyze Vidyo’s disconnect reasons. You can now identify patterns and uncover which endpoints are having the majority of issues so you may address them. In order to make this possible (and easy), we have made each chart in vAnalytics “interactive.” This means you can click through to find the underlying data story.
In the example below, we can see in the Call Status Chart (left) that 183K, or 84% of calls, do not connect. In the Call Not Connected Reason Analysis Chart (right), we can see 154K of those calls that did not connect, 98% are due to “Callee Not Found.” This indicates a misdial or SIP spam attacks. Clicking on the details to view all these calls and find patterns in the dialing strings to figure out the specific issues is now possible with vAnalytics.
You can also export and share a specific data story with an engineer or support personnel so they can take immediate action. If you find trends, you can automate these exports to send daily, weekly or monthly until the issue is eliminated entirely.

3. Optimizing Technology Resources
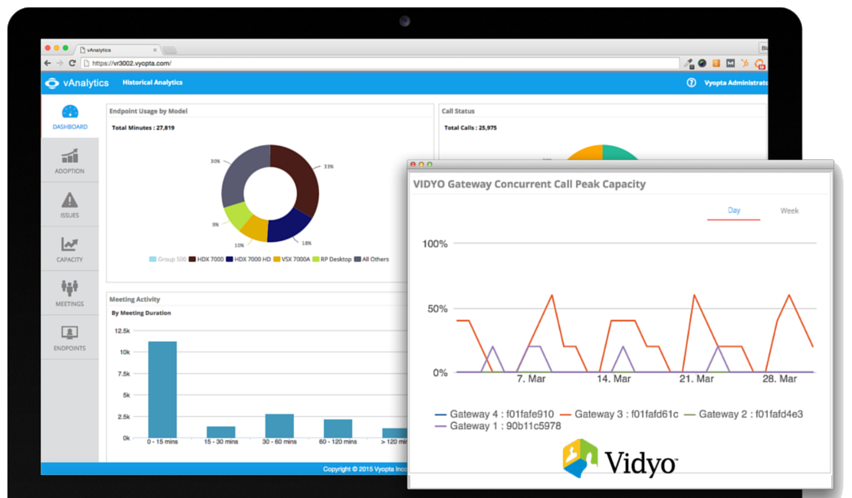
Although setting up a Vidyo deployment is pretty straightforward, there can be a few complexities regarding routers and gateways for internal, external, and transcoded calls. Vyopta’s vAnalytics offering will show you the total capacity in VidyoPortal Lines, the capacity per Router, and the capacity per Gateway for each calls. Now, an administrator can ensure they have the right number of VidyoRouter and VidyoGateway devices to handle network needs, especially when the increase in staff adoption sends usage skyrocketing.
By adding Vidyo to our vAnalytics product offering, we provide yet another powerful tool for CIOs, IT Managers, and Collaboration Architects. Now, you can meet your organization’s productivity goals without having to deploy and learn yet another incomplete and isolated reporting tool. vAnalytics helps businesses manage a collection of video collaboration networks, and making the best decision for you no longer depends on what technology you, your partners, or your managers are familiar with. You can now select what works best for you, and have comprehensive and accurate data to determine what’s working for your end-users.