Recently, Vyopta launched our new upgrade to Real-Time Monitoring and Alerts that includes comprehensive call quality monitoring. Many of our customers liked the way we united capacity and usage information in our Historical and Real-Time products and desperately wanted call quality information the same way.
Our initial release brings data from VCS call control devices, bridging technologies from Cisco, Pexip, and Acano, and endpoint monitoring directly from Cisco endpoints. The best part is, for those of you who have already upgraded to Real Time Monitoring and Alerts, this capability comes for free in your current package.
What’s New With Our Monitoring Features
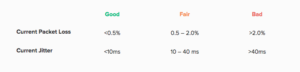
Today in our product, you can see this information is presented in two new tabs and one existing tab with new features; Active Calls, Active VMRs, and upgraded Endpoints. To simplify the process of identifying bad calls for video collaboration administrators, we labeled calls as Good, Fair, or Bad according to the ranges of jitter and packet loss identified for that call leg. We based this system on call quality benchmarks from our experience monitoring millions of video calls of all kinds.
Dashboard
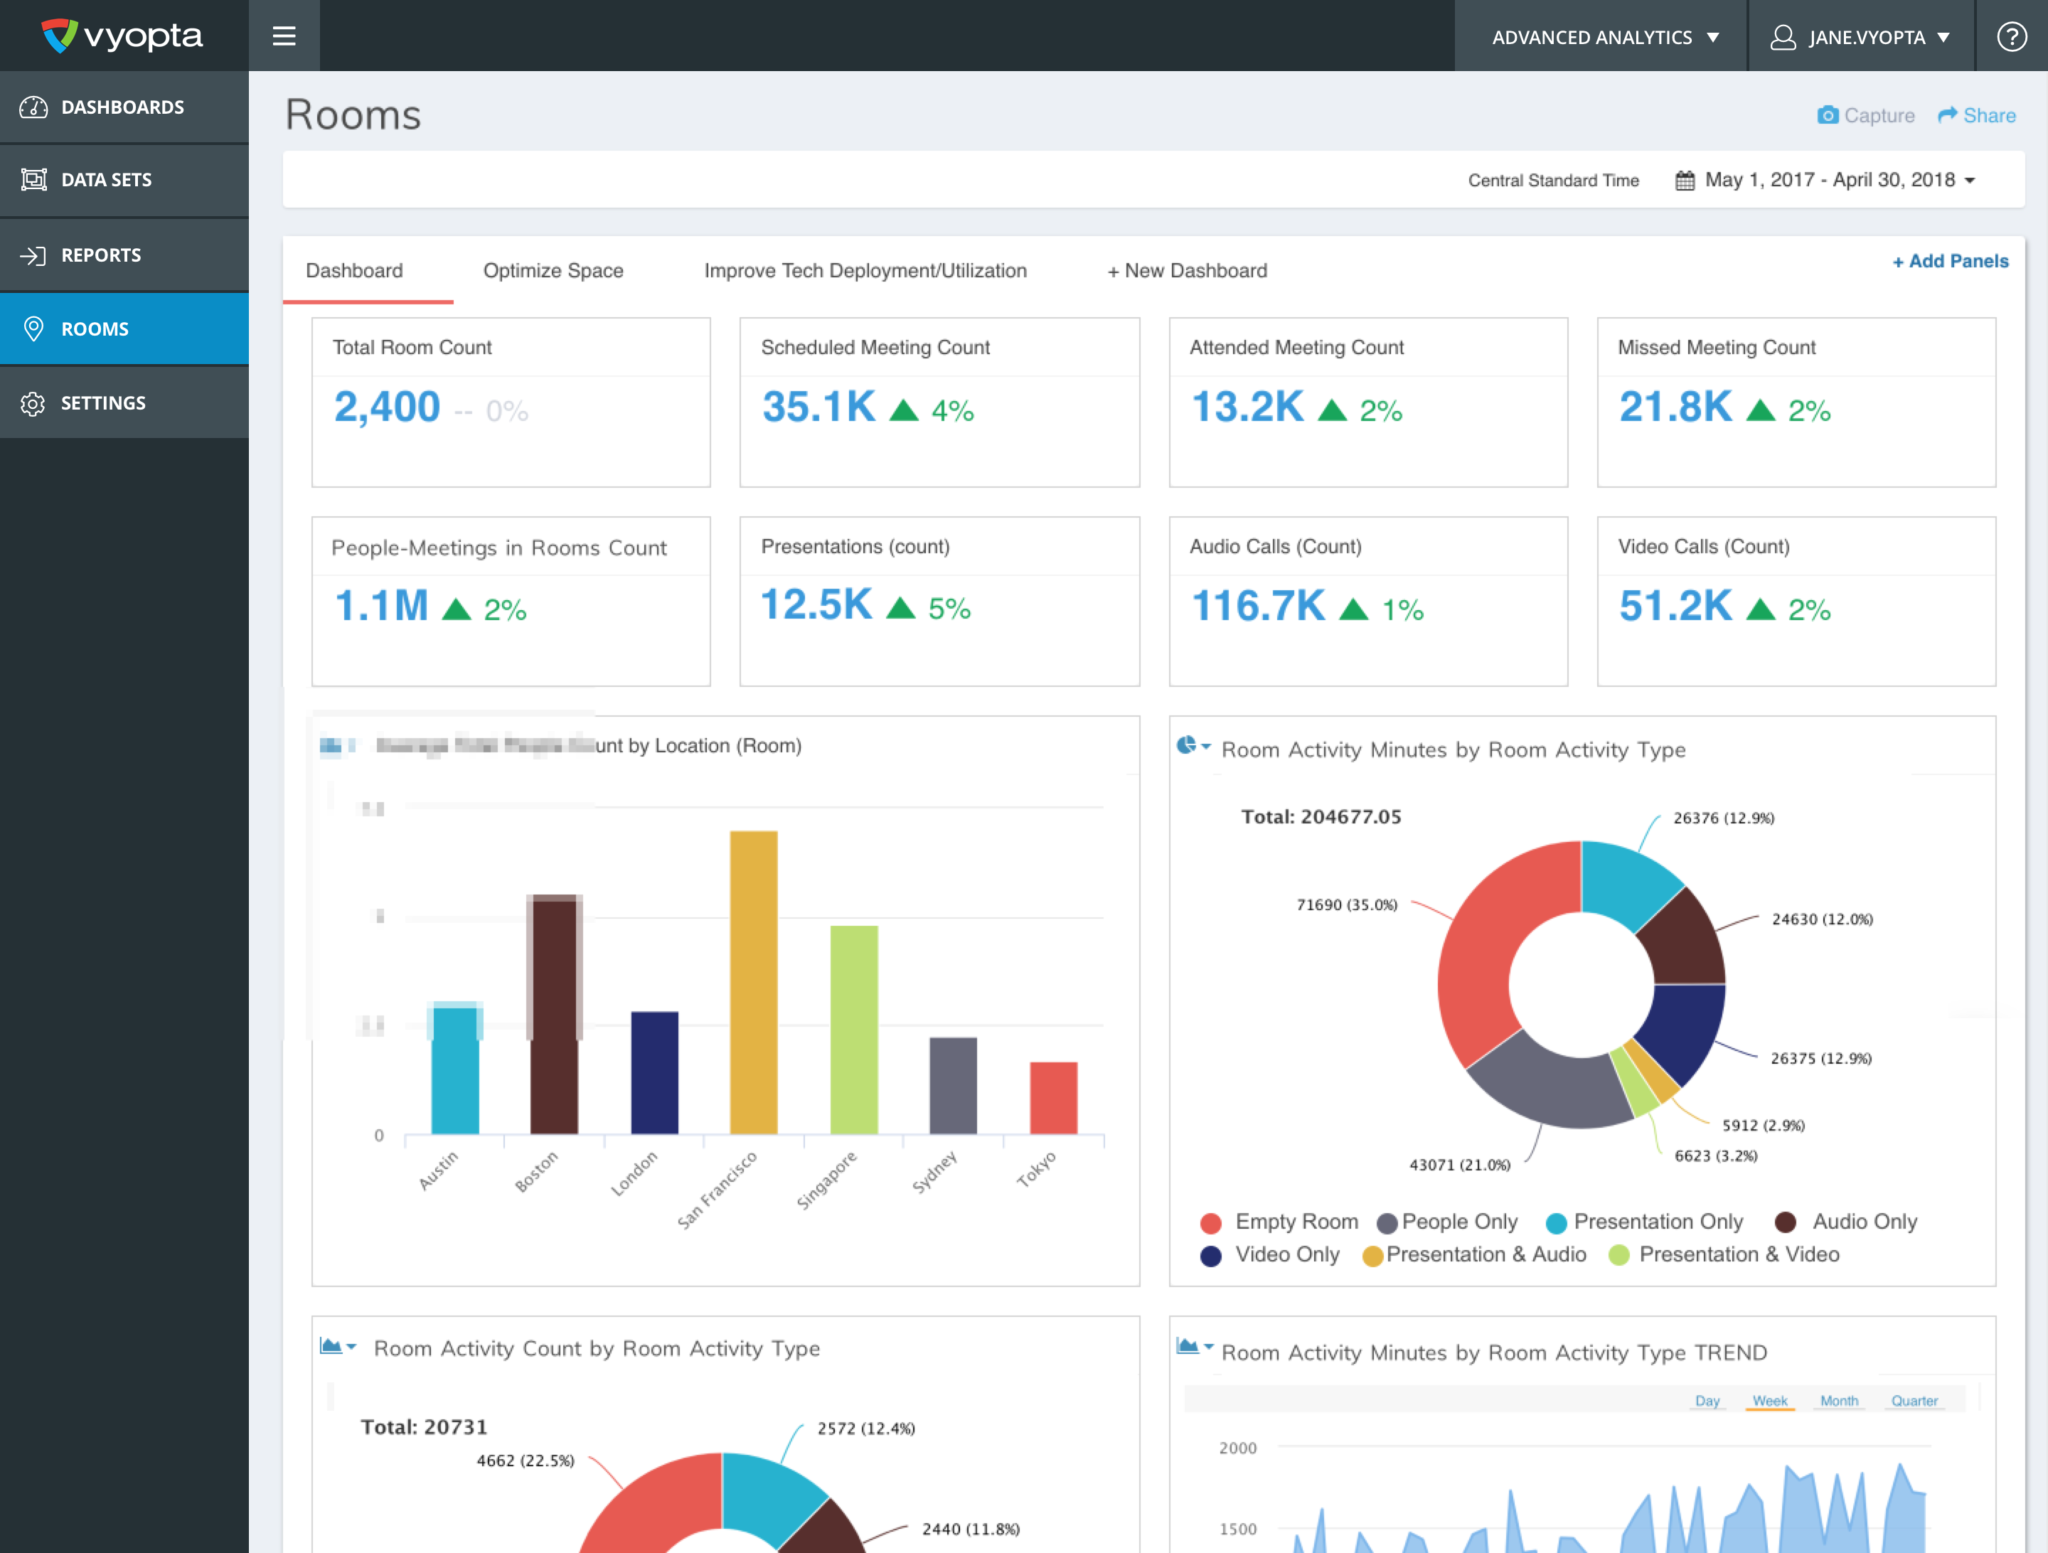
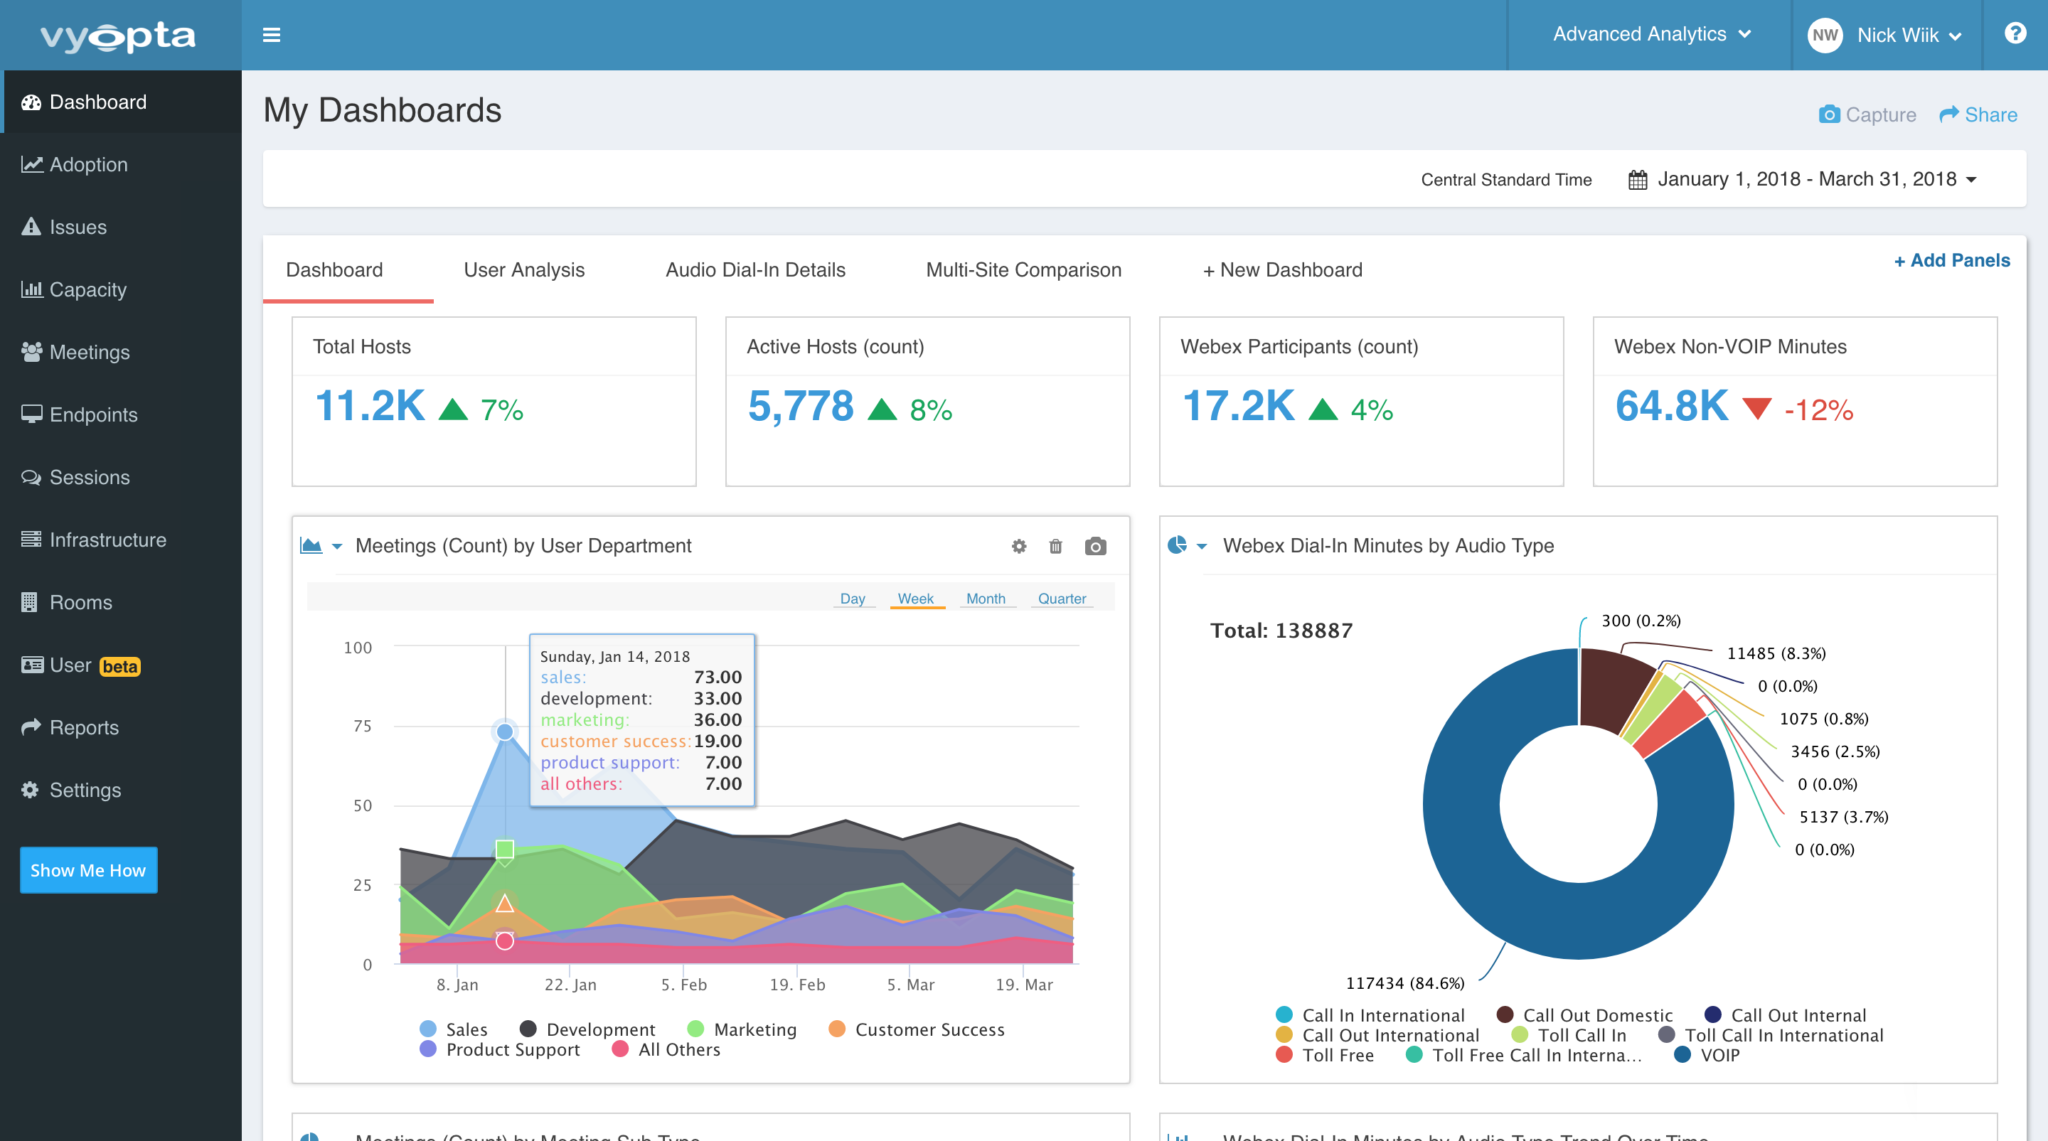
You will also notice some upgrades to the dashboard. First, there is a new panel that can be added that tracks all call quality resources and summarizes how many calls are currently being monitored and how many fall into Good, Bad, and Fair categories. There are also some new features that were discussed in this blog (insert link). Just like our other dashboard panels, the data elements in this new panel are clickable to go straight to finding more detail.
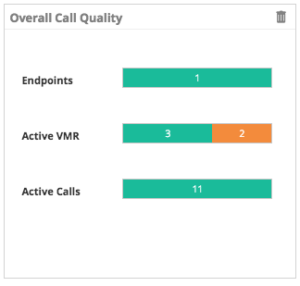
Figure 1 Real Time Call Quality Overview and Definitions
Active Calls
Active Calls pulls data from VCS-C and VCS-E call control devices. The data is collected every 0.5 seconds and displayed every 15 seconds. Call quality information is displayed from the perspective of the device it is collected from, so transmit is what is going away from the VCS and receive is what is going into the VCS.
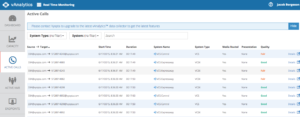
Figure 2 Active Calls Tab
Clicking on the Icon under details will open a new window that provides details for bandwidth, frame rate, codec, packet loss, and jitter for every channel of the call (audio, video, presentation) as well as graphs that show two minutes of activity that starts collecting once the details window is opened.
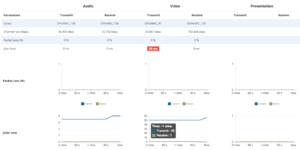
Figure 3 Call Quality Details
Active VMRs
Virtual Meeting Rooms are the new term for the technology where multi-party video meetings happen. This includes Pexip VMRs, Acano Cospaces, Cisco (Codian) MCU ports, Cisco TP Server ports (or screens), and more in the future. For each Meeting Room, we monitor all channels of all participants.
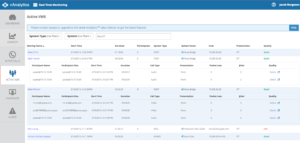
Figure 4 Active VMR Quality
As you can see, you can click on the meeting room to display the participants, and then you can again click on the Icon under details to open a call details window very similar to the one in Active Calls. For those organizations with large environments, the search bar is active search and works across all the columns. You can also see that there is filtering by infrastructure type and device. Again, call data is shown from the perspective of the VMR, and data is collected for audio, video, and presentation channels.
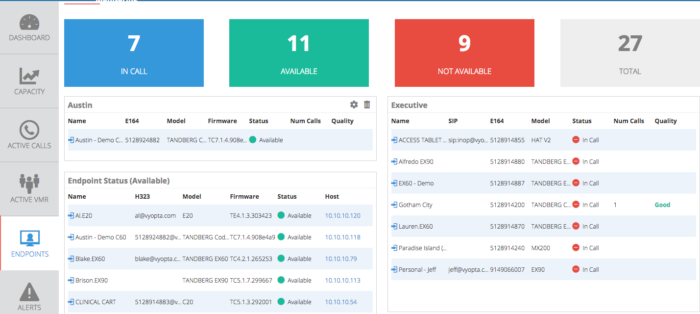
Endpoints
The final addition to the product is the Endpoint Monitoring capability. This requires an extra data collector, and you can contact your Customer Success representative at Vyopta at [email protected] to find out more about that. The reason we require an extra data collector is because we are talking directly to the endpoints themselves over SSH. This captures the “last mile” of the video call, which allows vAnalytics to analyze the full call path and identify the source of call quality issues both quickly and accurately. However, depending on your usage of video and your network configuration, you might not need an Endpoint Monitor.
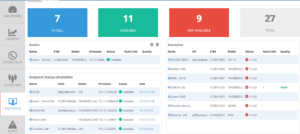
Figure 5 End Point Quality Monitoring
Endpoint monitoring only displays call data for Cisco Endpoints today that have a call in progress and have had their credentials entered into the vAnalytics Administrative portal. All the details of this simple process are outlined here in the deployment guide.
Clicking on the Call from this window opens up more details on the call, and then clicking on the details link opens a new Call Details window just like in the previous tabs.
Summary
Video is growing rapidly and the technology is changing even faster. IT teams need better tools to stay ahead of the curve. The goal of this product update was to provide Video Collaboration teams the tools they need to support video calls in a new, faster, more effective way. With real-time call quality now added to capacity and status information and alerts, Collaboration managers can start maintaining and improving the health of their network, stay ahead of complaints and support requests, and easily identify issues for quicker resolution.
We plan to extend this monitoring to other technologies we work with like Cisco UCM, Lync, Polycom and Vidyo over time, and we also are working on ways to deliver actionable insights from this information to make lives for IT managers simpler. Let us know in the comments what features you would like to see next!