Webex capabilities: new enhanced features with analytics & monitoring
This is perfect timing, because we are also expanding our support of Webex and integrating the service into our Advanced Analytics module!
Today customers use Vyopta to increase collaboration usage 44% annually and improve efficiency by 20%. Our new Webex updates will help our customers continue maximize the value of their collaboration technology investments – even in cloud + on-premise and multi-vendor environments.
In the rest of this blog post you will learn about the key enhancements, how new users can sign up to trial the service, and how existing customers can.
New vAnalytics for Webex capabilities
Key features and capabilities of Vyopta’s expanded analytics for Webex include:
- Multi-site integration of Webex data into Vyopta’s Advanced Analytics so enterprises with large Webex deployments can optimize their entire deployment with one tool.
- Webex Teams (formerly known as Spark) messaging utilization.
- Expansion of Webex data segmentation by site, department, location, or other custom data field to drive actionable insights by user group.
- A more flexible analytics interface with hundreds of possible visuals and unlimited dashboards that can be delivered automatically.
- Insights and metrics to improve the efficiency of audio and licensing costs.
- A fast and easy self-service deployment for new customers that takes only seconds to sign up.
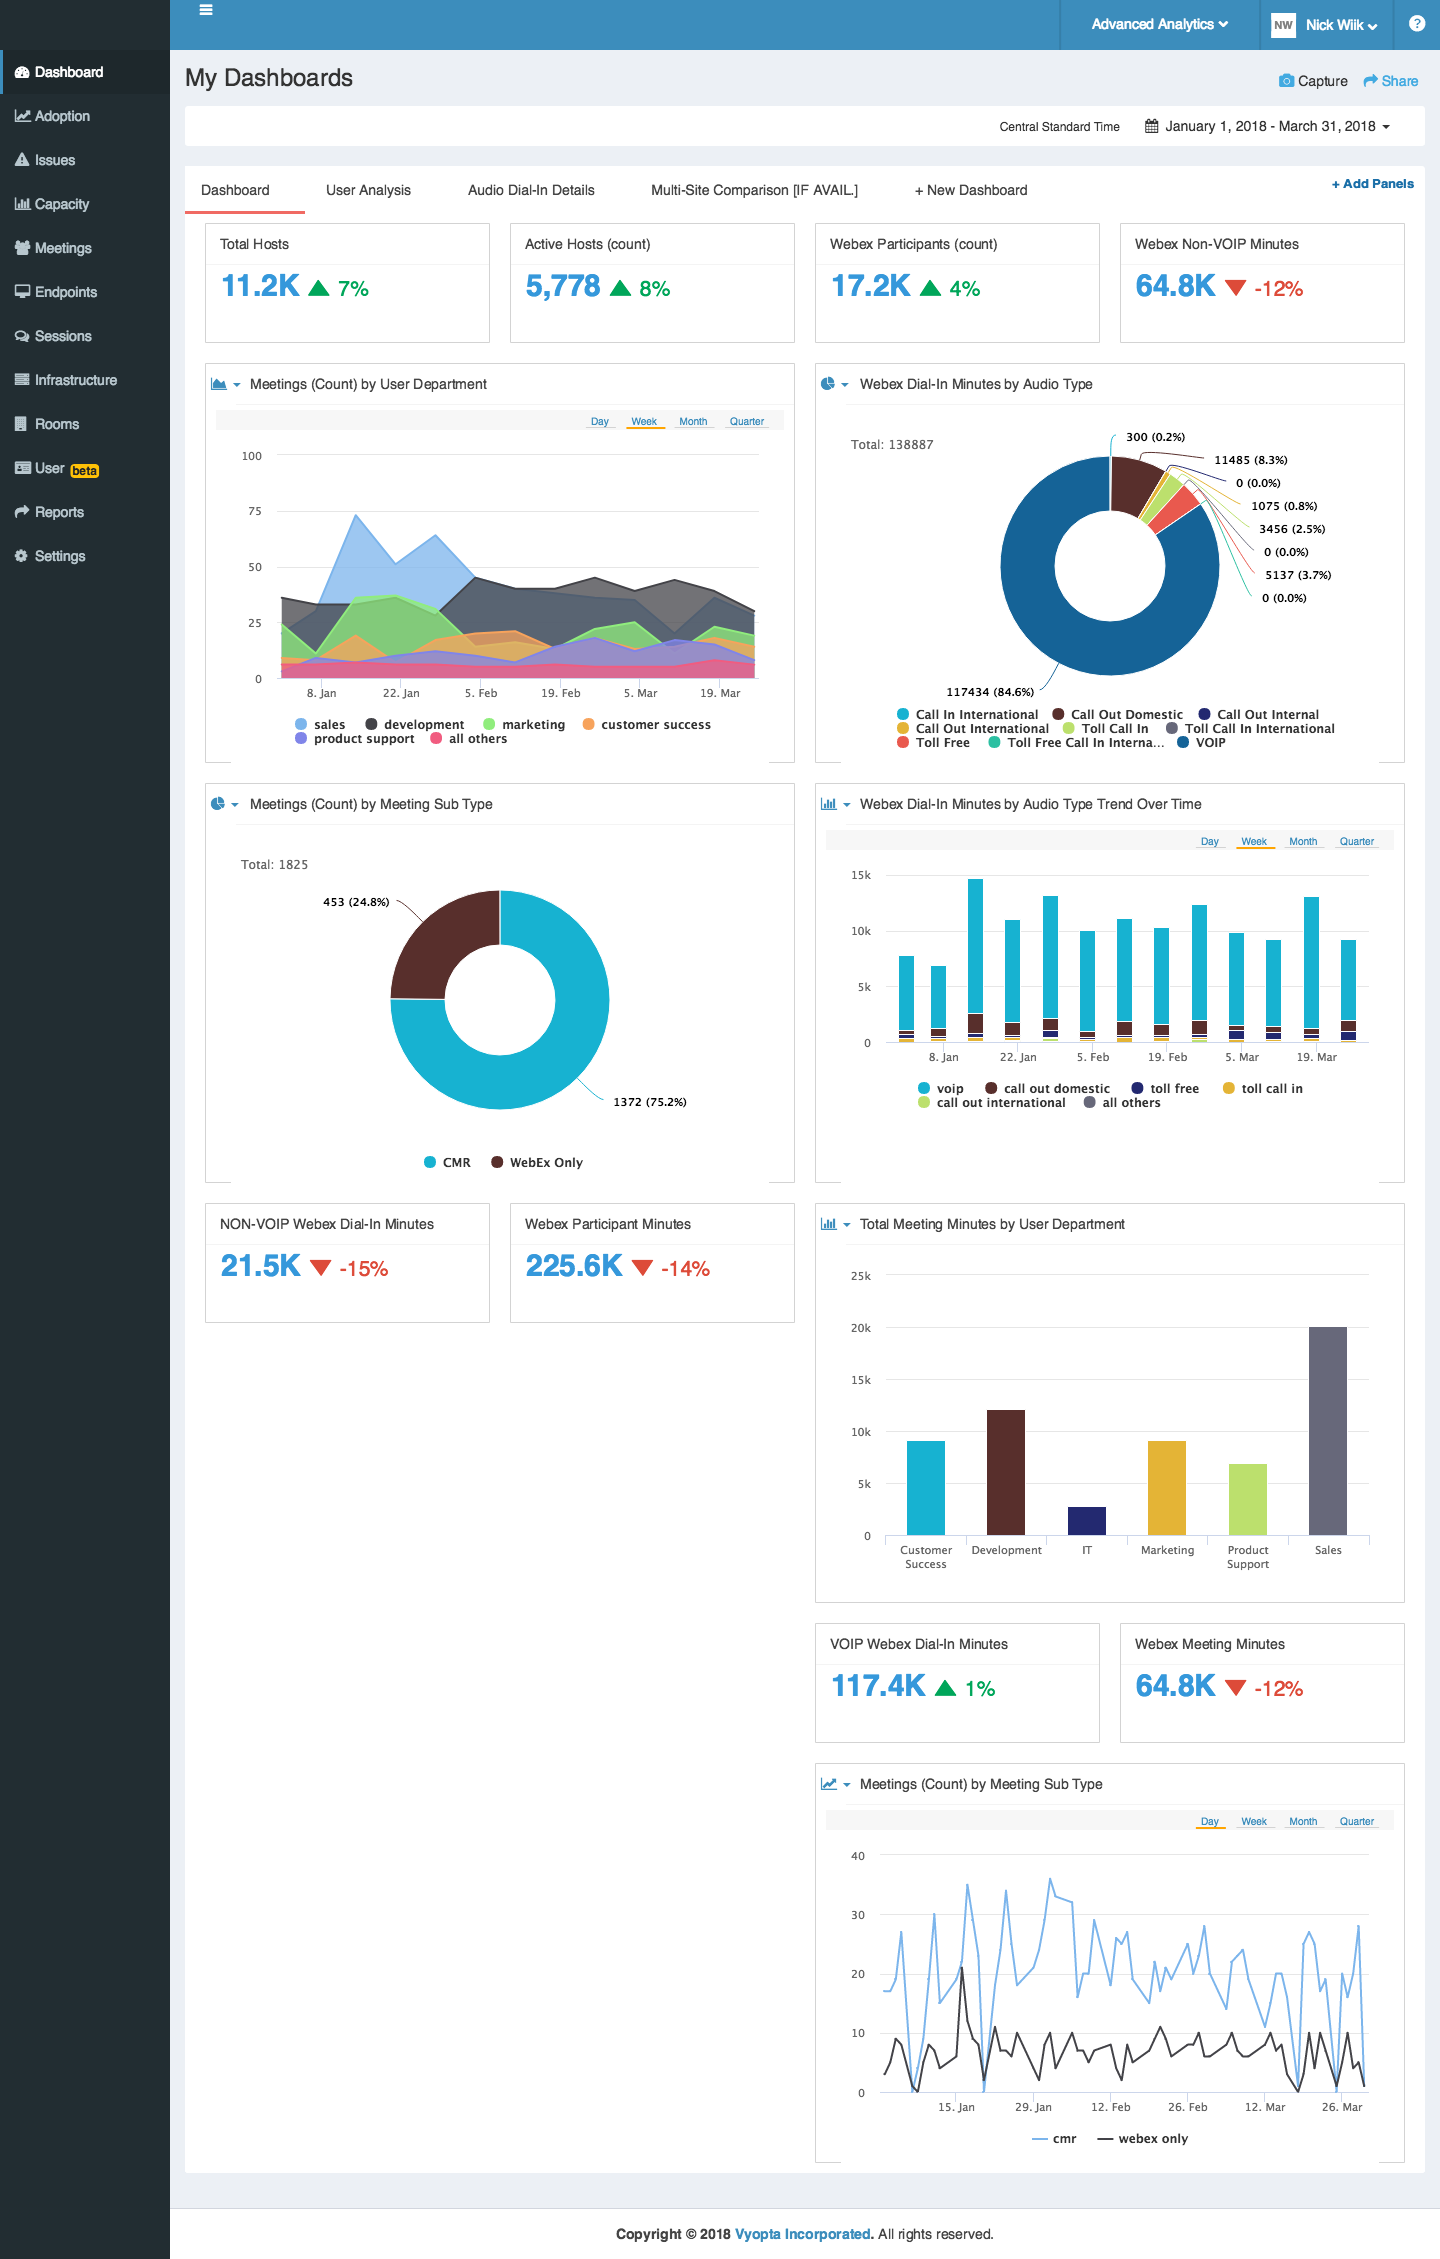
New Panels Galore!
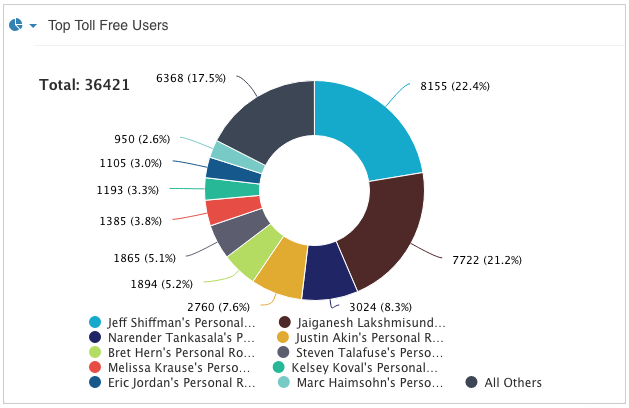
You can now dig more into audio details around the different PSTN categories (Toll, Toll Free, Call Back, VoIP) and understand who is using them the most by looking at the breakdown of minutes per meeting. In the chart above, you can identify that there are 2 users who account for nearly 45% of the total Toll Free minutes here at Vyopta! That’s coming out of your paycheck!
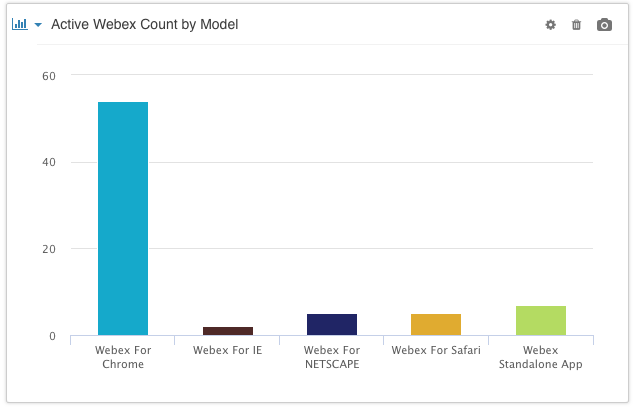
UC managers can now track Webex Calls, Meetings, Minutes and Users by Endpoint or Browser Type to understand how users are joining meetings.
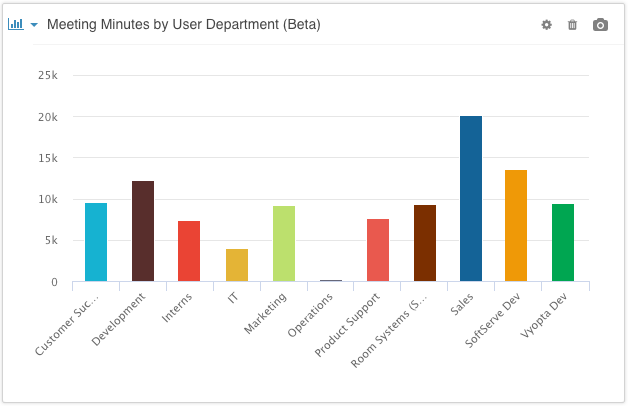
Many Webex deployments have departments associated with users. Now you can take advantage of that and use it to segment calls, meetings, hosts, and minutes according to those labels. This makes it easy to craft adoption reports that are relevant to your organization in order to allocate costs or adoption resources efficiently.
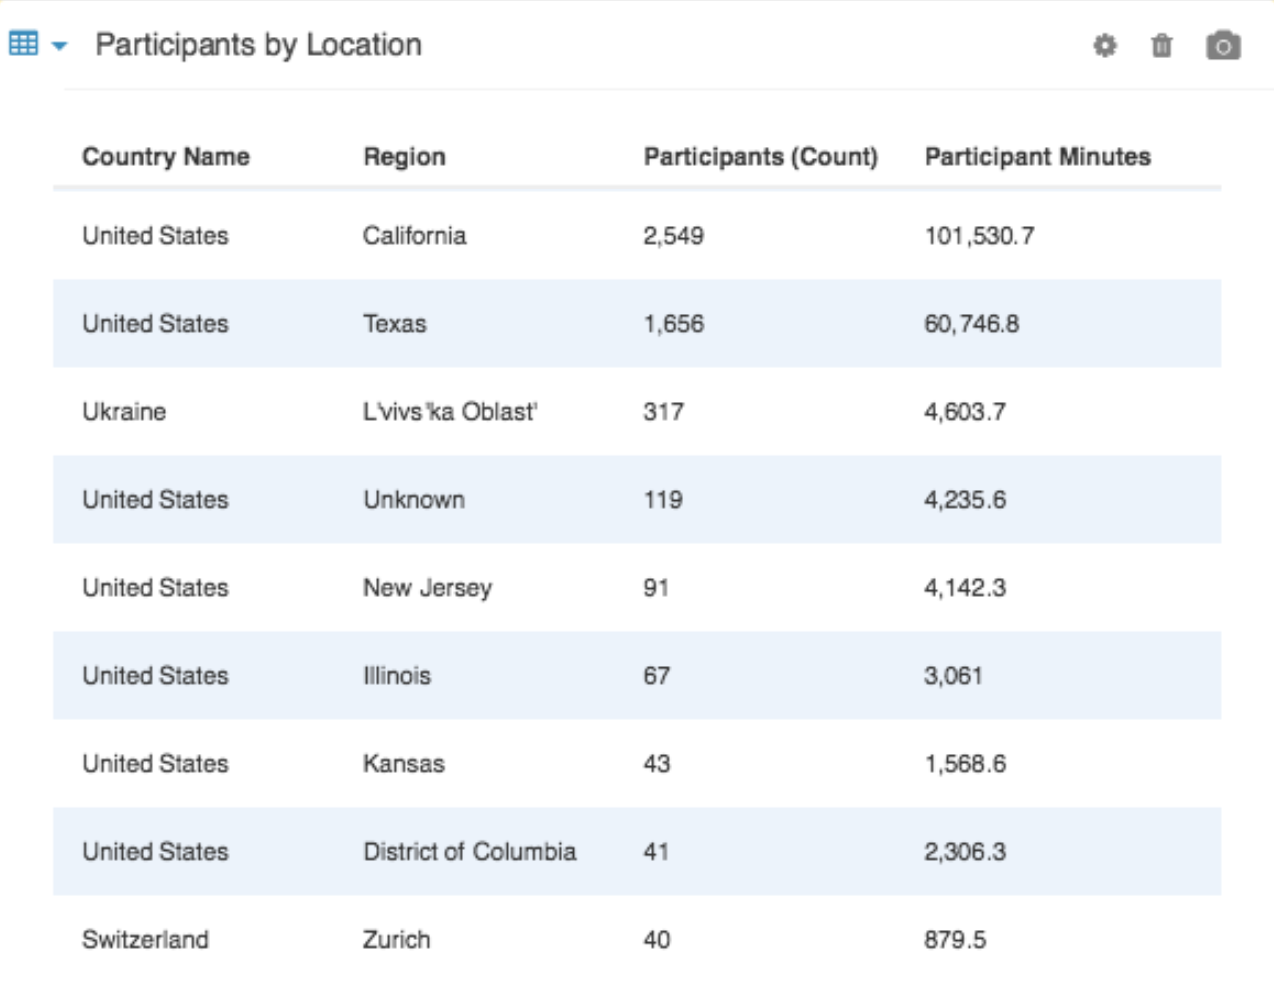
For existing customers, this used to be a heat map. This was cool to look at, but not very useful. Having the data in a table means it can be used and understood more easily so you can learn more about the regional usage and attendance of Webex meetings. This is useful for planning audio costs (especially now that Cisco has added 20 more countries to their list of free audio options).
Here are additional capabilities you can find out more about in our Knowledgebase:
- Participants by call type (audio or video)
- CMR vs Webex Meeting trend
- Most and Least Active
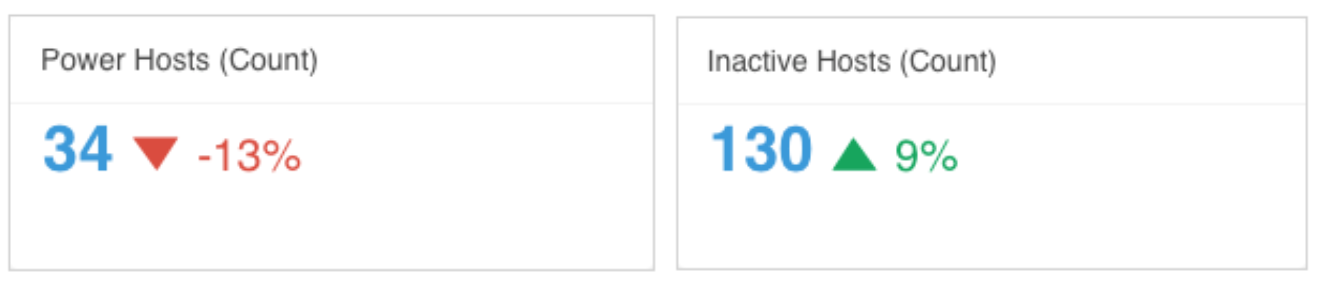
- KPIs for Power Hosts and Inactive Hosts
- Filterable KPIs
- Multi-site integration (and site filtering) across different Webex sites
How to sign up and try CPM for Webex
For New Customers
Signing up and getting your Webex insights has never been easier. You can sign up in a few seconds, all you need is Webex credentials for an admin or view-only admin account and Vyopta will start collecting the information to power you Webex Analytics. Wondering what it will look like for your organization? Kick the tires on a free 14 day trial with no credit cards or payment required, really.
For Current Customers new to analytics for Webex
If you are an existing Vyopta customer but are not using Webex today, to try out the new and improved service simply contact our customer success team by sending an email to [email protected] and requesting a trial of analytics for Webex.
For Current Customers already using analytics for Webex
Existing Analytics for Webex users will migrate to the new service in the month of May
- Your Analytics for Webex module will cease to function 12:00pm CDT (GMT-6) May 31st, 2018.
- To migrate to the new analytics for Webex service you need to reach out to [email protected] or respond to one of our emails before May 31st.
- We will copy the features from the existing Webex into new dashboards in Advanced Analytics (if you reply to the migration emails or contact [email protected])
- The Participant Heatmap chart will be replaced by a more useful table.
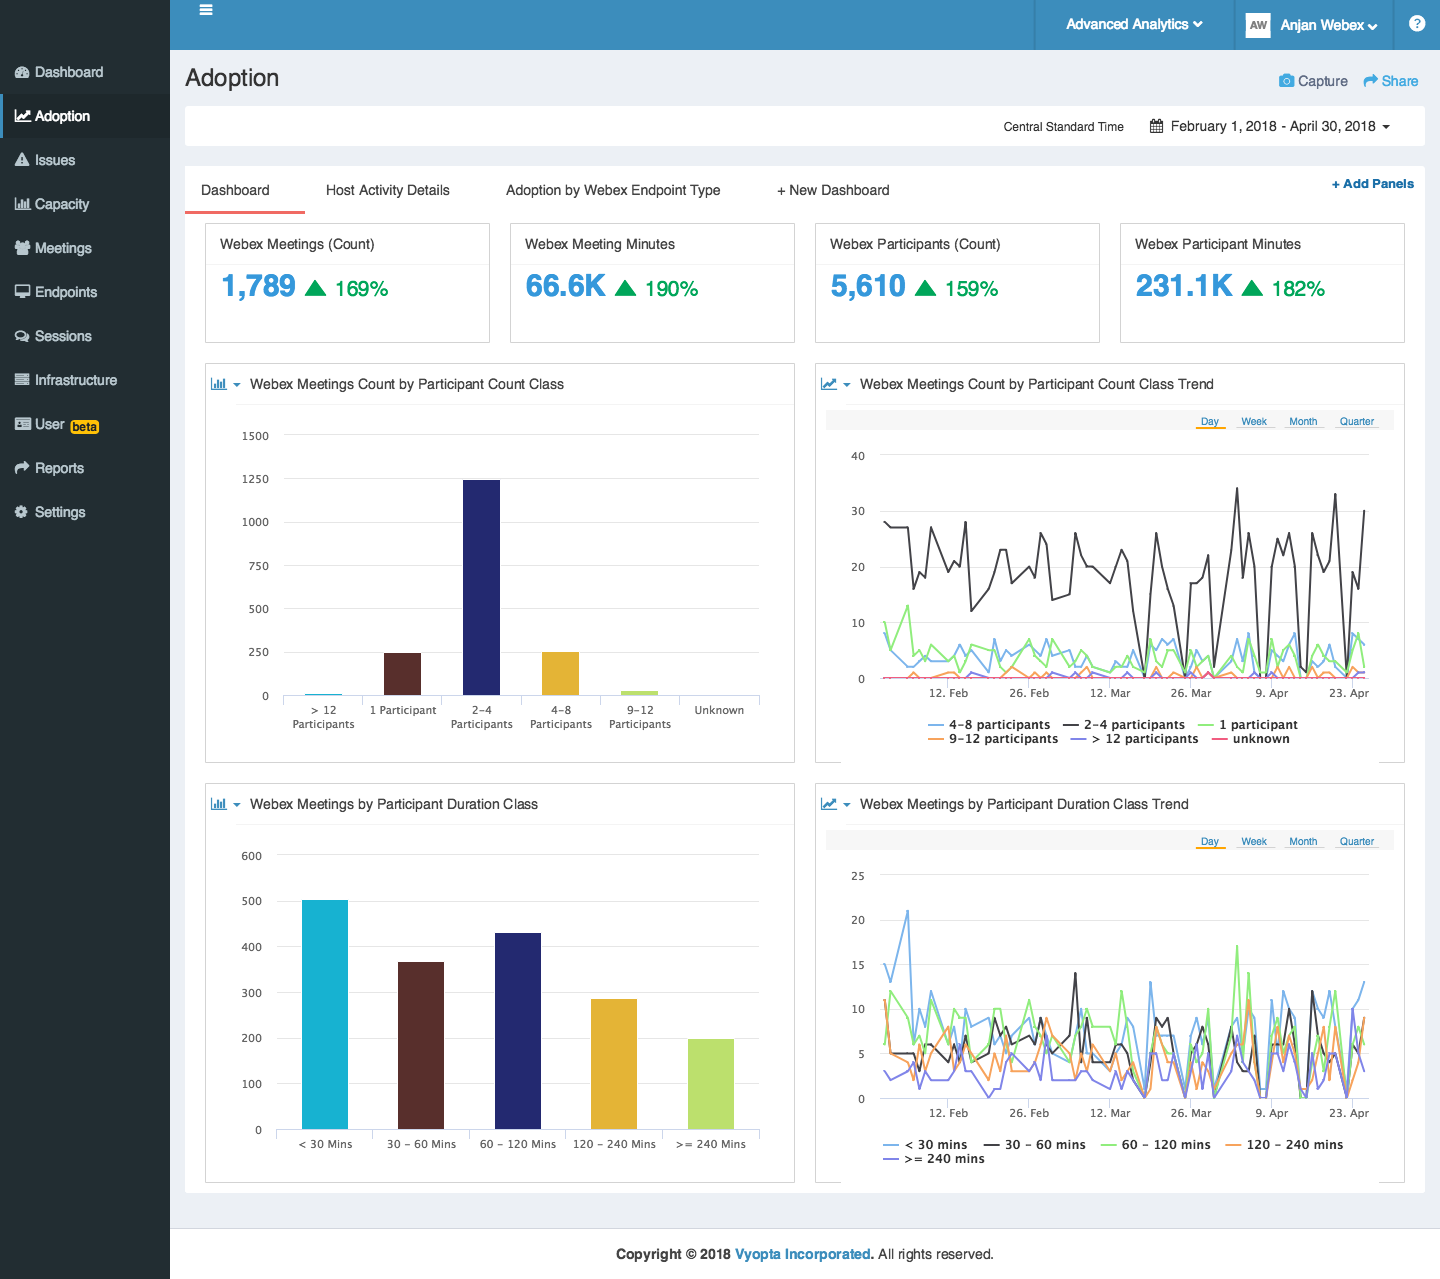
- You will have more flexible dashboards which I outline below.
- For more information about using analytics for Webex in Advanced Analytics, visit our Knowledgebase.
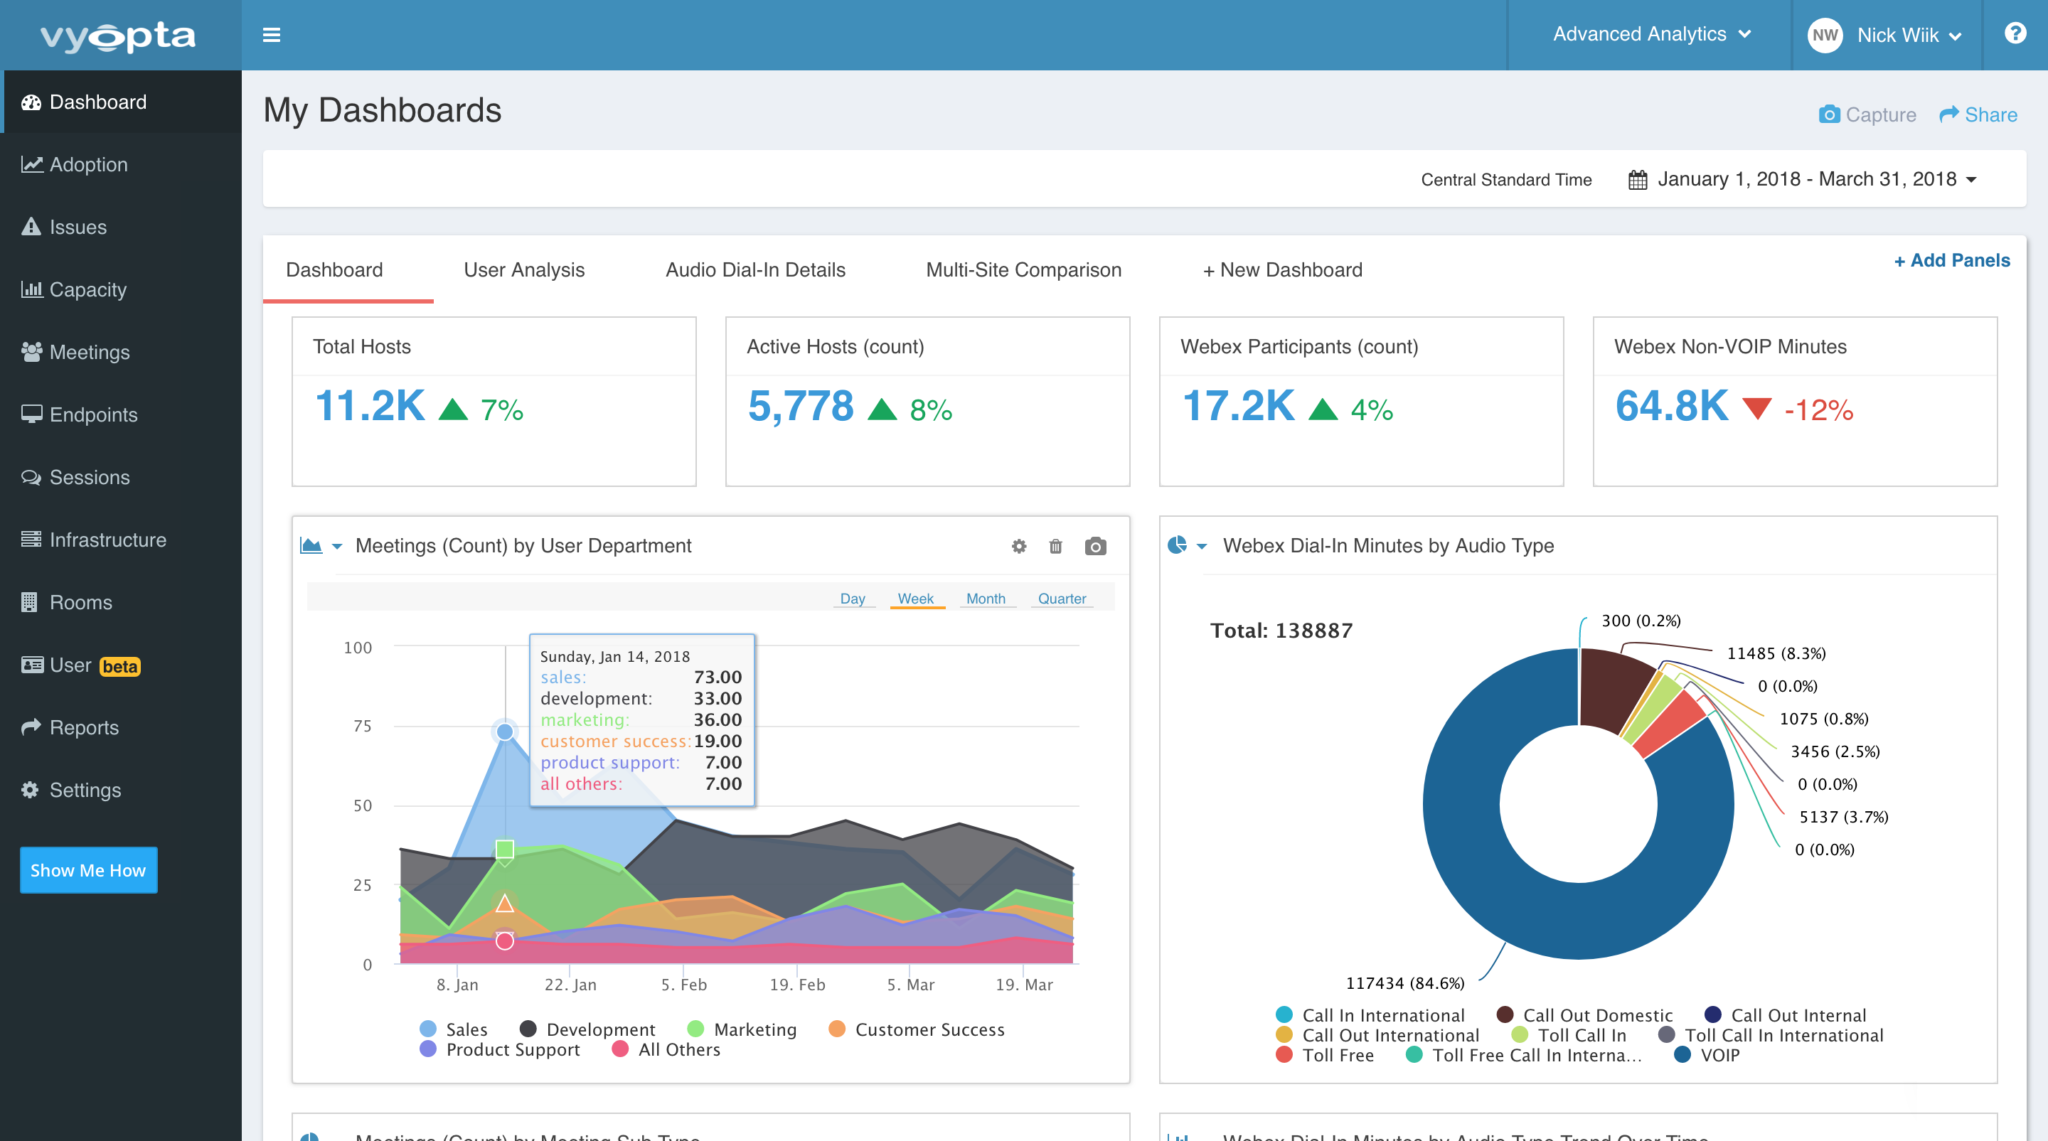
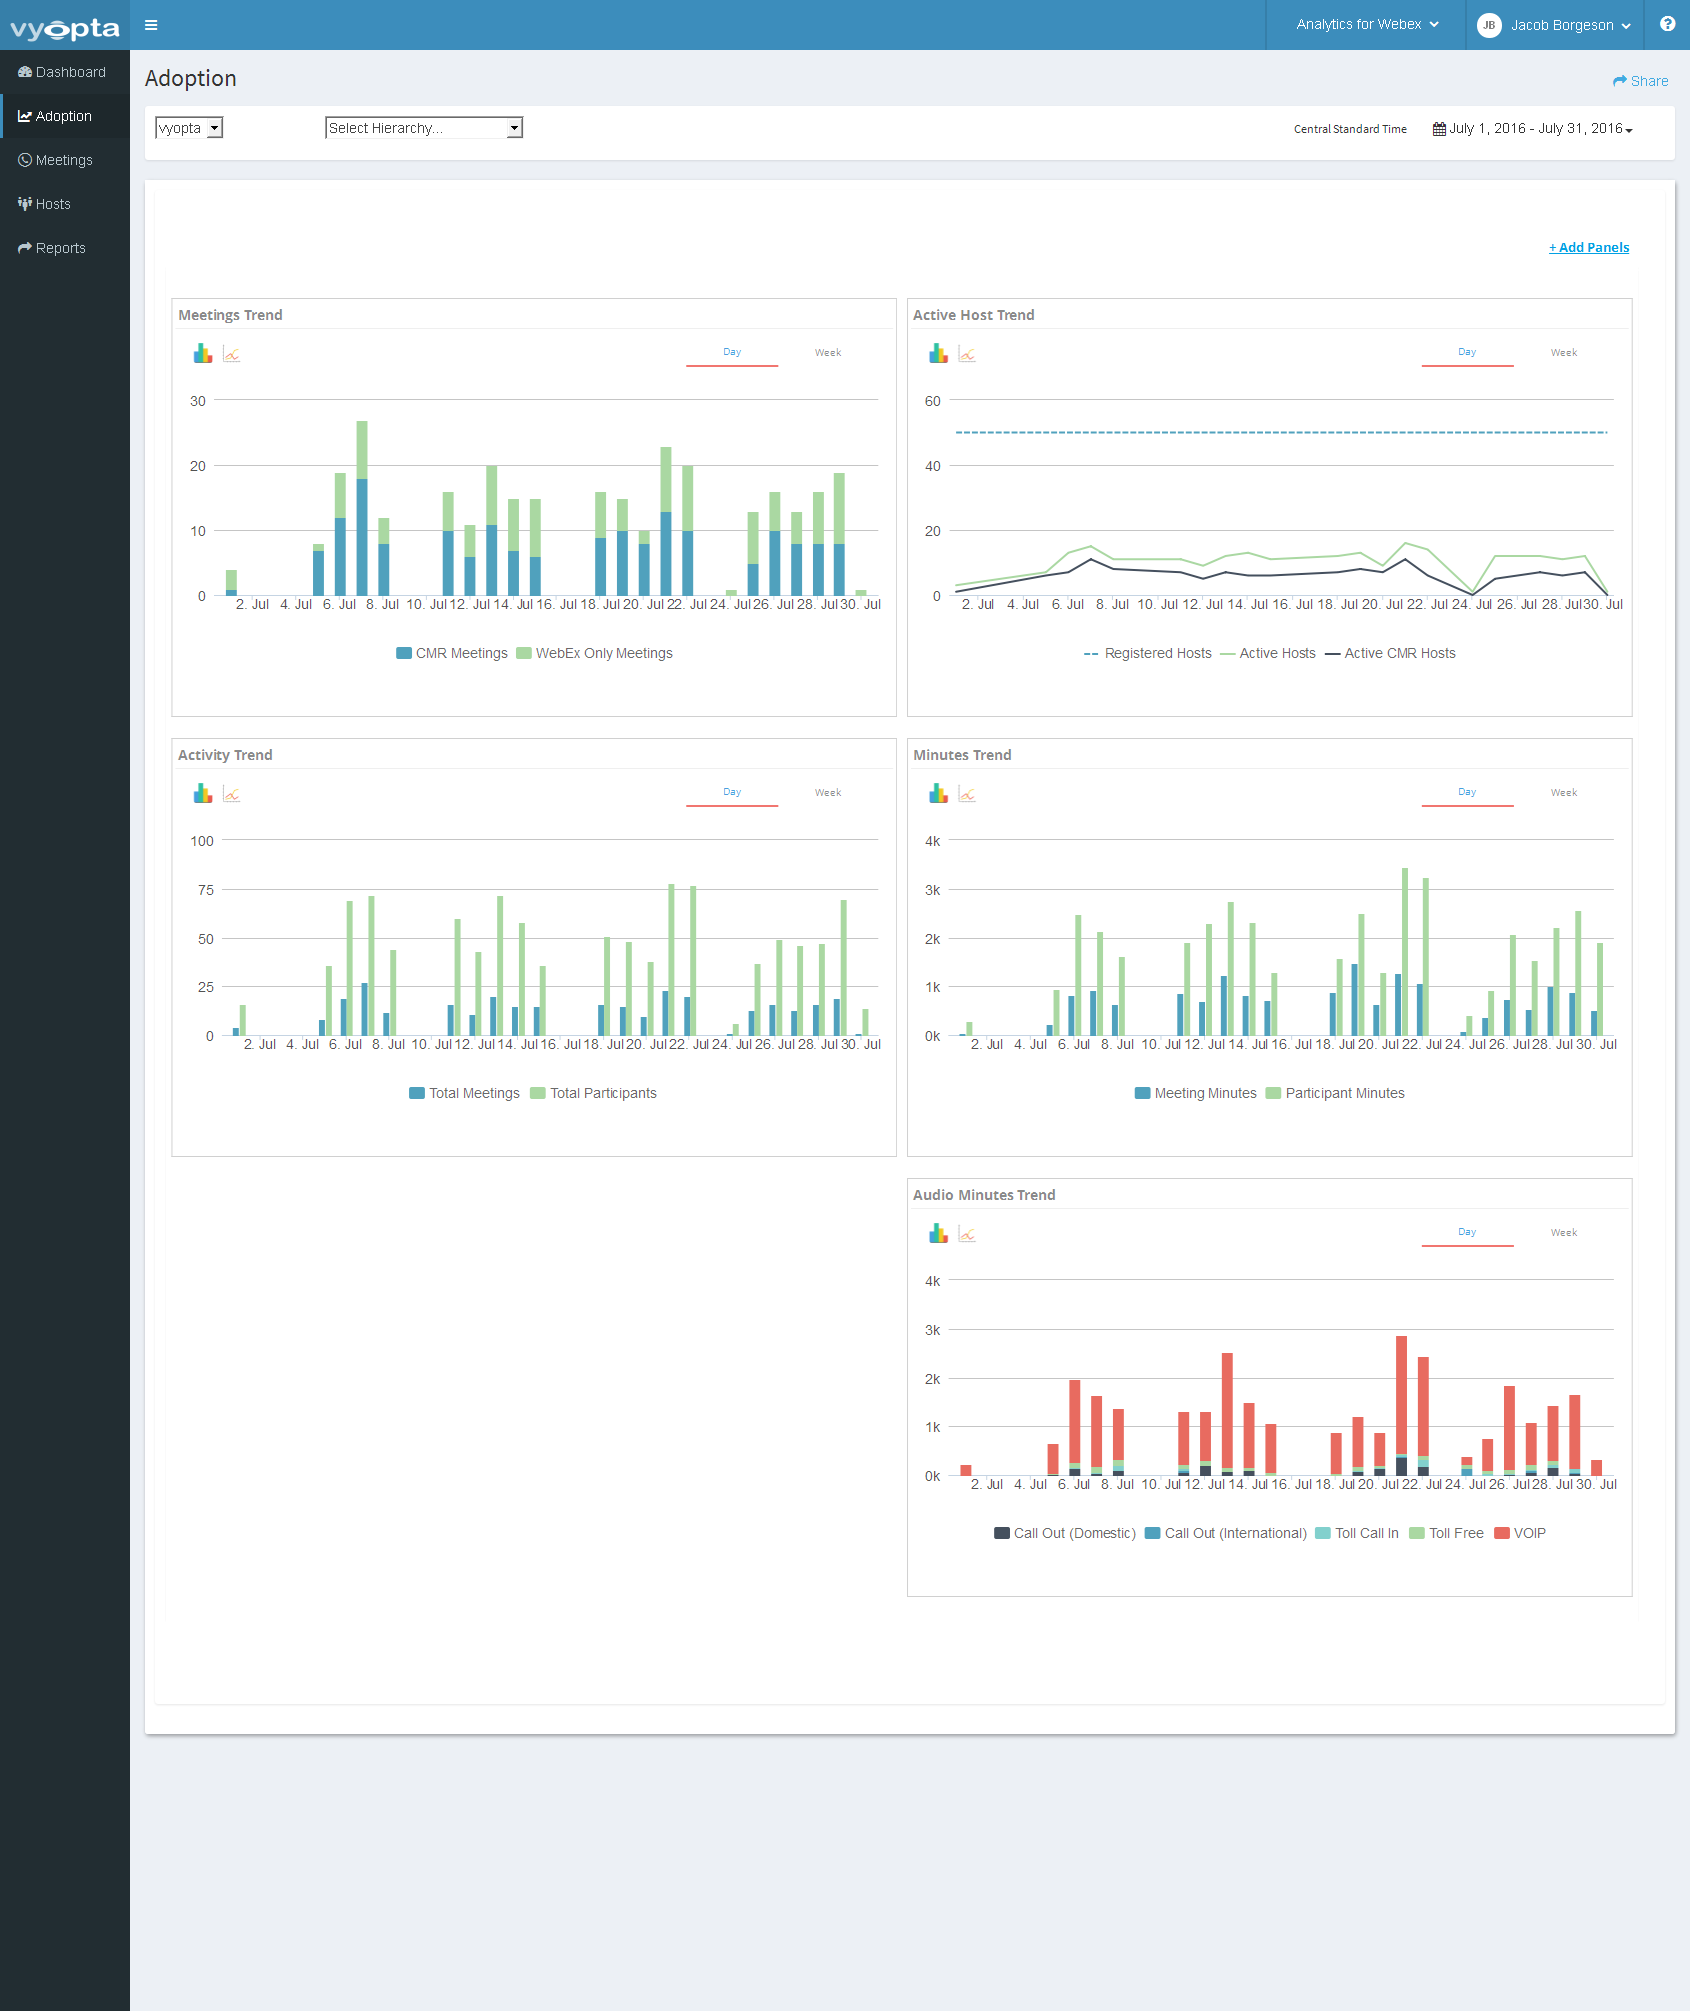
Below is a screenshot of the current default Analytics for Webex dashboard.
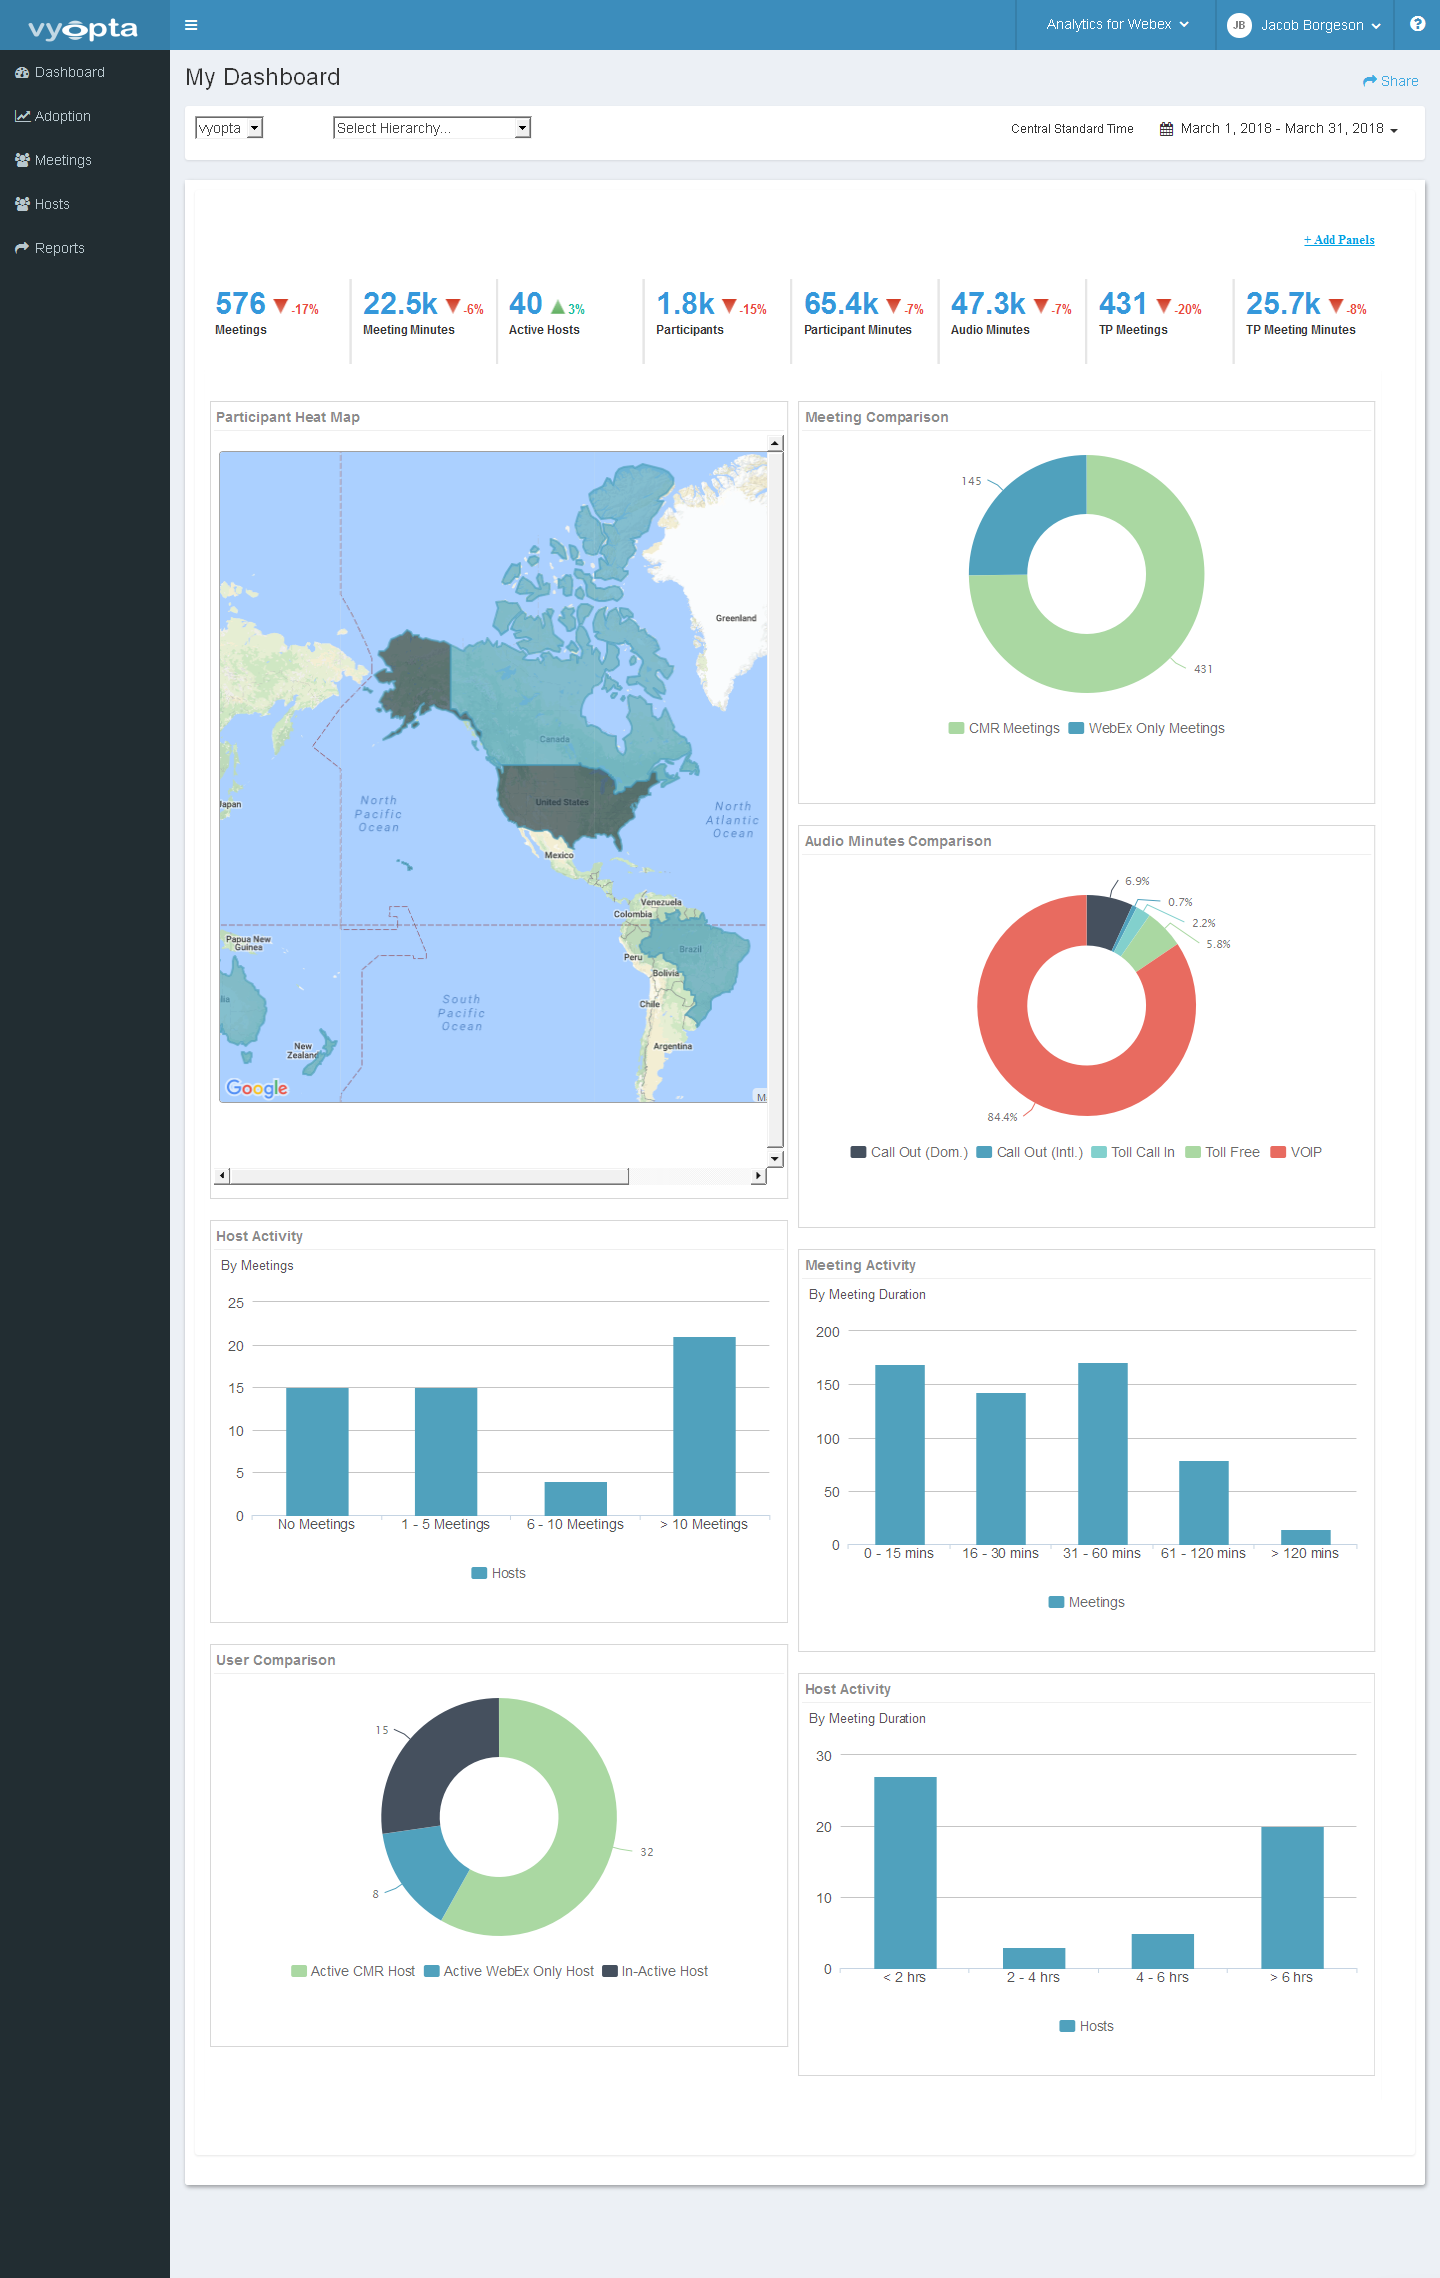
The old adoption dashboard (pictured below) was limited to five panels. That was it.
Go Forth and Webex!
That’s it!
We are really excited about these product improvements. Go forth and use Vyopta to unlock the full potential of Webex!