How it Works
Explore the features of Vyopta’s Technology Insight Solution.
Platform Features
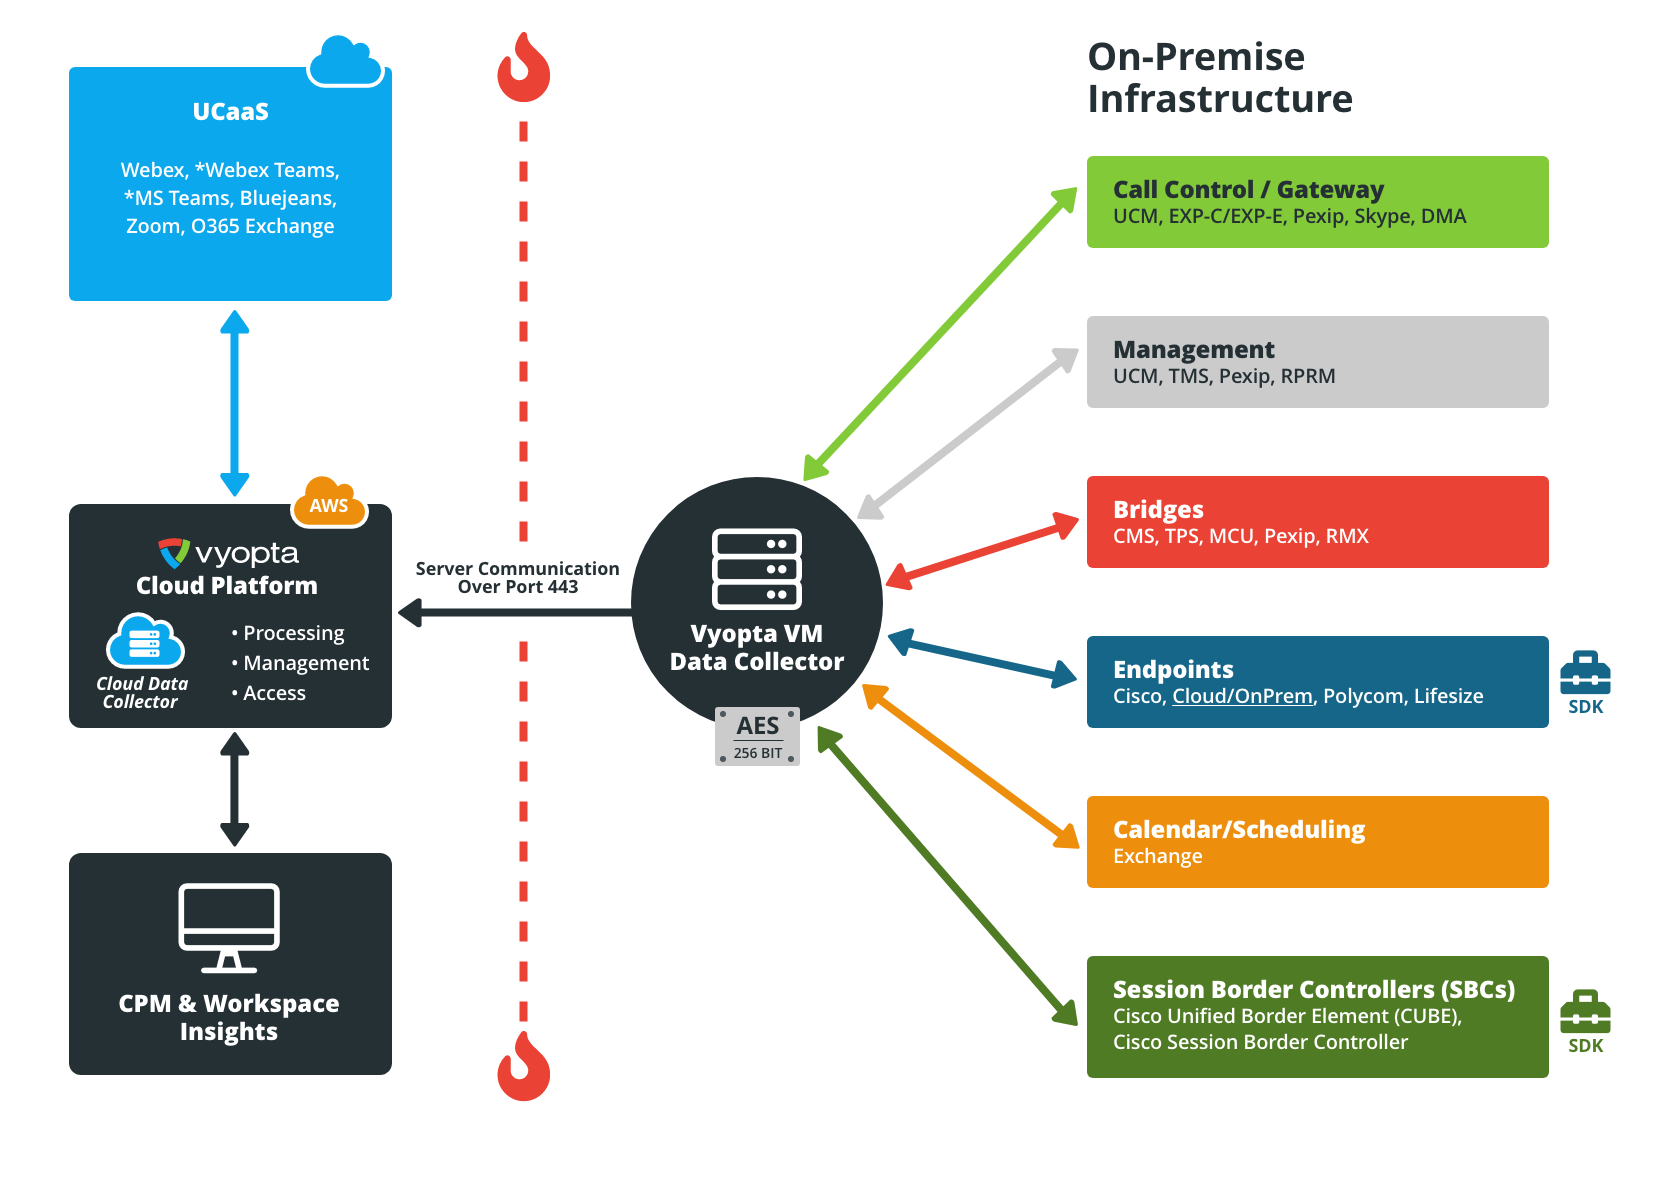
Complete 360° Hybrid UC Coverage
Simple Deployment, Setup, Maintenance
Powerful Data Management
Elastically Scalable Architecture
Interactive, Customizable User Interface
See Features by Module
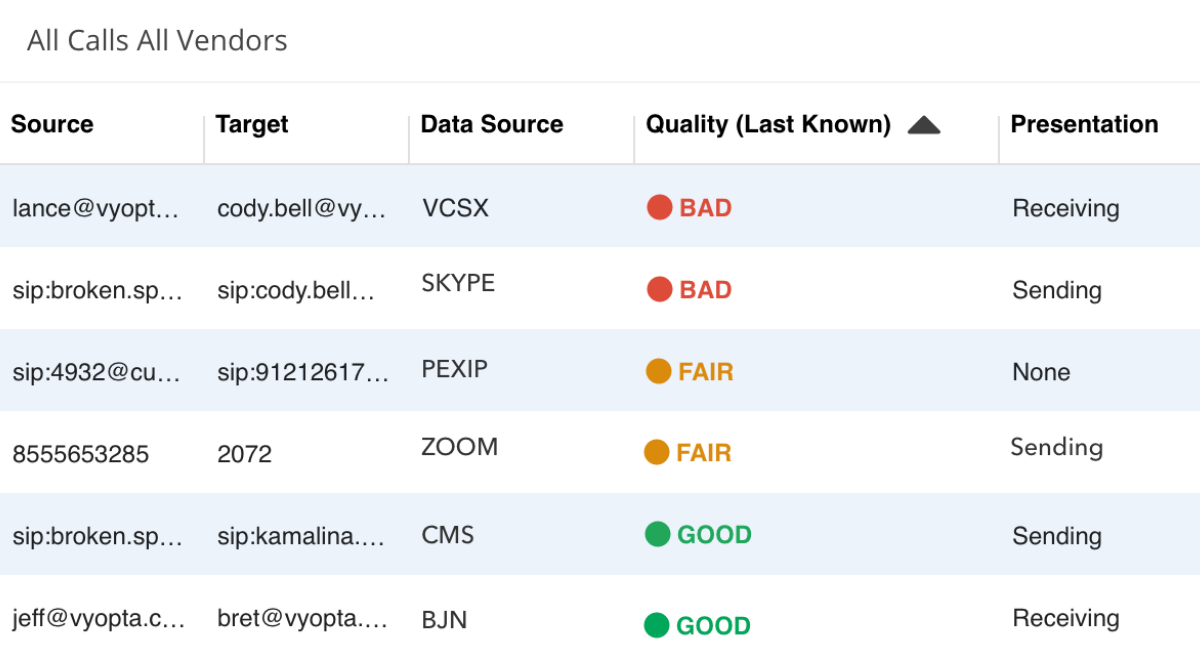
Find all calls in one place
Unify all of your UC data, and quickly locate calls
Trust one source of truth
Unified, normalized data in a single pane of glass
Easily filter, find specific calls
Flexible search, sort, filter, and grouping of calls
Complete UC Coverage
Multi-modal, multi-vendor support across hybrid IT
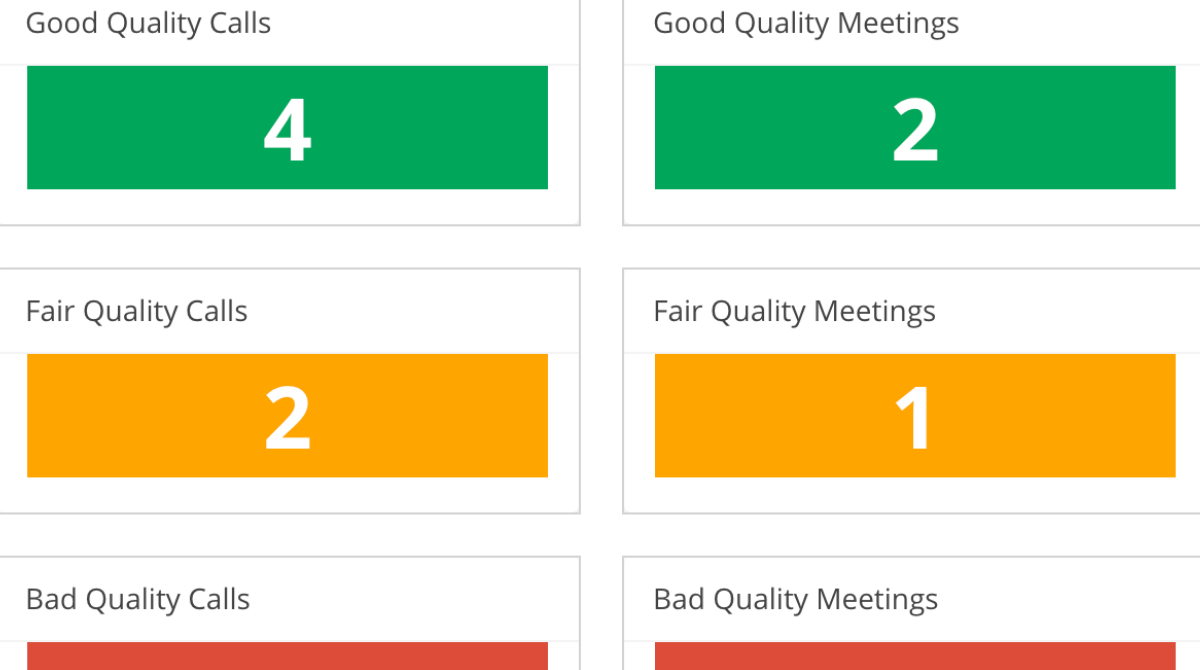
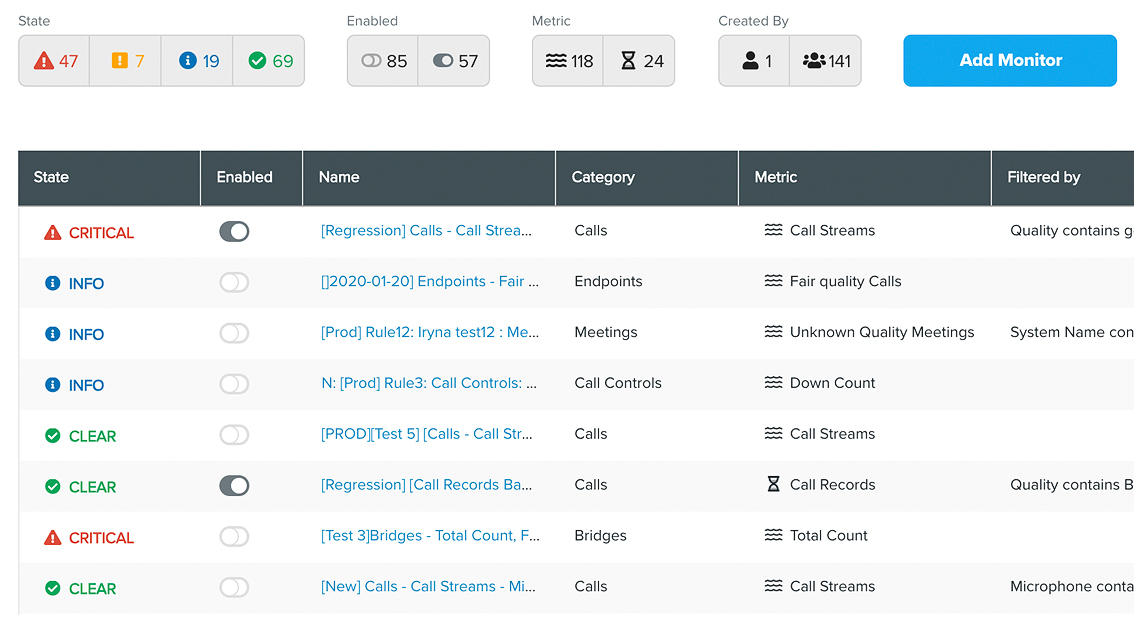
Get a quick pulse on call health
Find problematic meetings, troubleshoot call legs.
Monitor live and recent calls
View live calls or rewind to desired timeframes
Track bad, fair and good quality calls
Sort & identify problematic calls for troubleshooting
See meetings and their call legs
See how every leg relates to the broader meeting experience
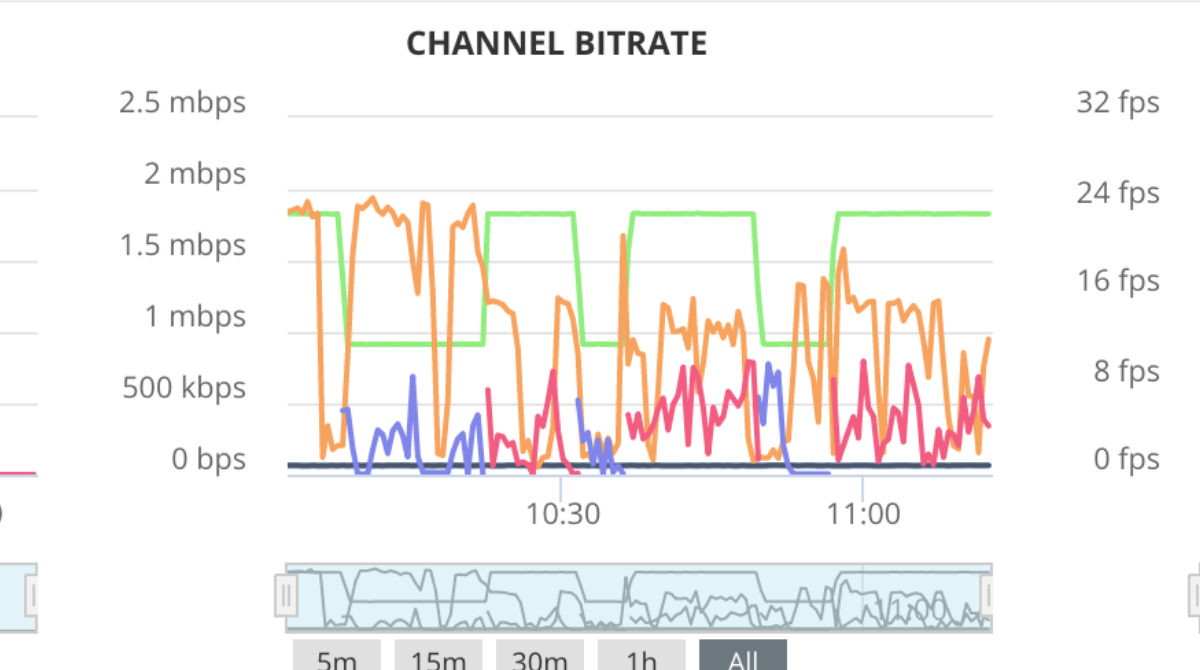
Get deep quality & health metrics fast
See reports, time-series charts to better diagnose issues.
Explore detailed charts with raw quality metrics
Jitter, latency, packet loss, and more across call modes
Assess endpoints and camera, touch panel, display, mic peripherals
See availability, temperature, CPU usage, and mic mute status
Easily fetch Call Detail Records (CDRs) at scale (See it in action)
View parsed, enhanced reports with error codes
Proactively detect issues and degraded experiences
Leverage Vyopta’s sophisticated Intelligent Monitoring Engine.
Configure alerts using 60 metrics, 350 filters
Alert on call quality, status and more, and set informational and critical event triggers
Generate notifications
Send e-mails or texts to alerts individuals or teams
Integrate with service desk
Alert on call quality, status and more, and set informational and critical event triggers
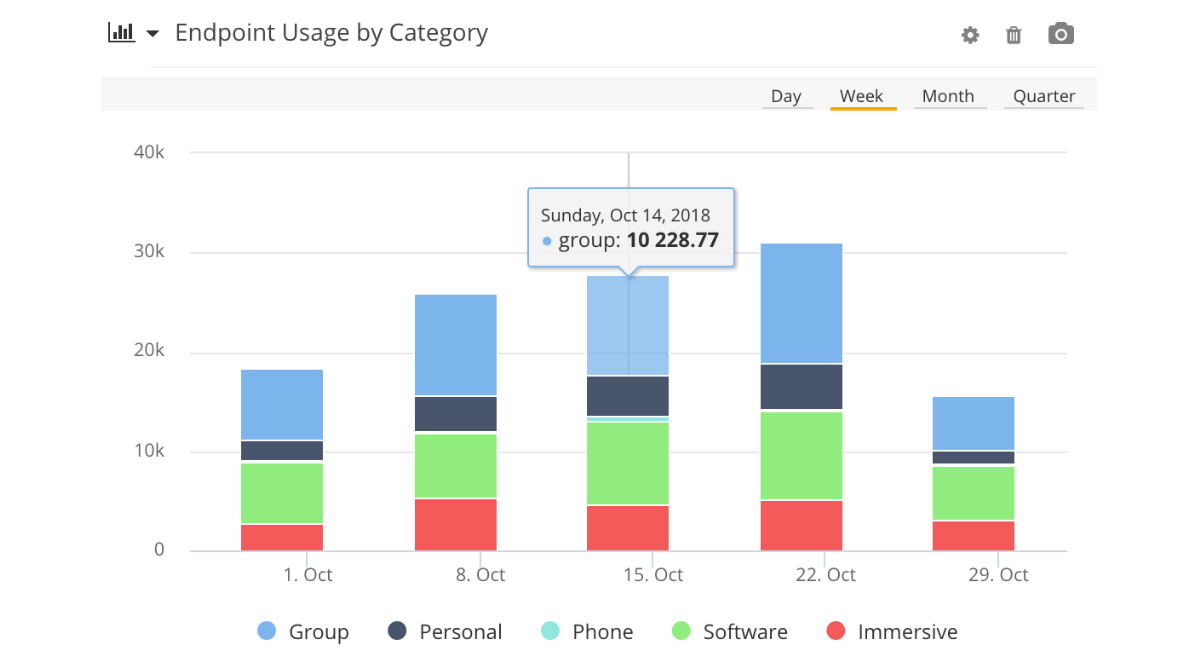
Better understand UC utilization
Analyze UC adoption trends and improve user experience.
Demonstrate impact of new investments
Follow how new technologies are being adopted internally
Track usage, ROI across technologies
Determine value and identify unused assets
Optimize user experience
Identify ways to improve usability and correct behavior
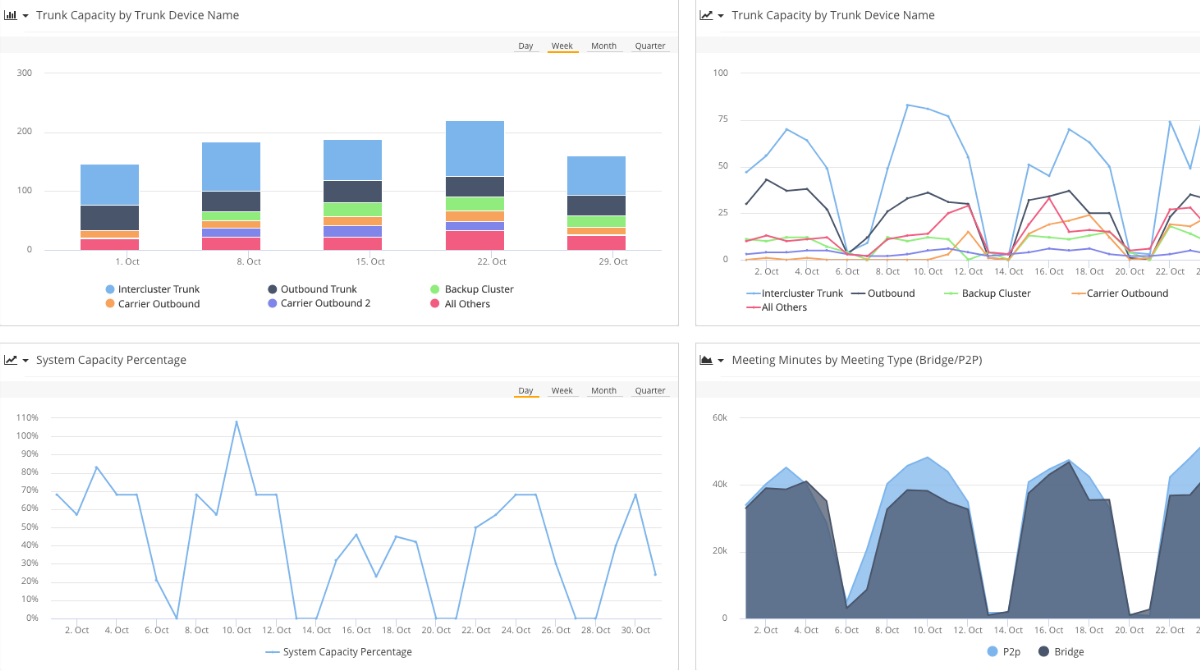
Analyze capacity and licensing trends
Track infrastructure capacity, license utilization over time to simplify operational planning and spend.
Prevent bridging and trunk capacity failures
Identify resource bottlenecks and seasonality trends to plan resource allocation and maintain uptime
Track migrations to new platforms
Plan, track, and adjust as you migrate or upgrade between bridge or call control platforms
Accurately and efficiently plan spend for growth
Know well in advance when you’ll need additional (or less) bridging, infrastructure, user licensing, or trunk capacity
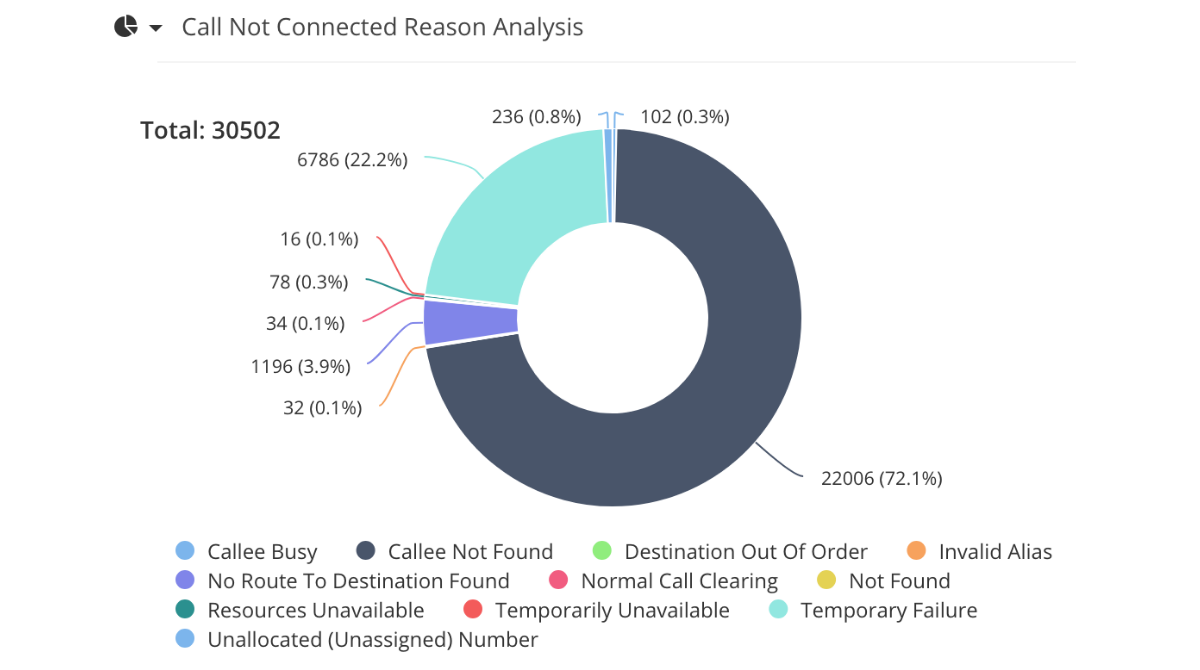
Uncover and resolve systemic problems
Get ahead of performance risks to improve uptime & experience.
Visualize call failure, quality trends
Track issues over time, compare days, weeks, months, quarters, years
Identify remediation actions
Identify improvement areas for call success and quality metrics
Track improvement over time
Track improvement and efficiency (which translates to productivity) over time
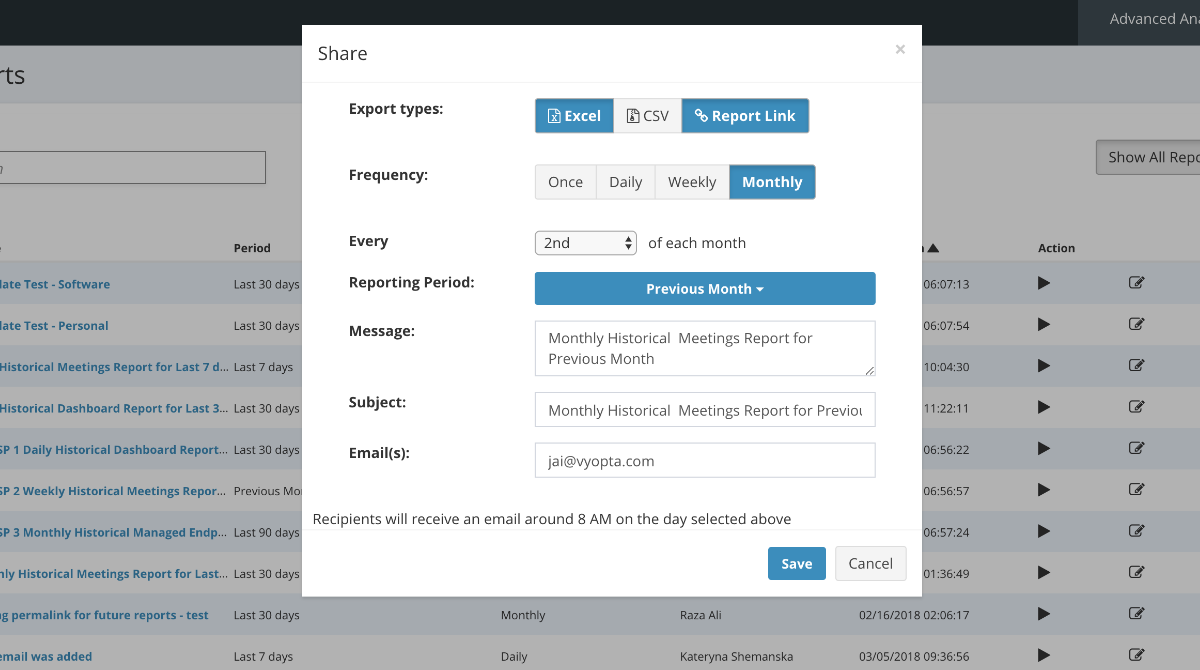
Save time through automated reporting
Build, save, send relevant reports to anyone, anytime.
Simplify report creation, avoid spreadsheets
Drag and drop critical KPIs, interactive graphs, charts
Make reports relevant with automated tagging
Leverage labels and hierarchy from call control or CMDB
Easily share reports to stakeholders
Schedule relevant reports to be sent out at regular intervals
Platform Architecture