However, the times they are a-changin’. More customers are asking us to share best practices and Key Performance Indicators (KPIs) for increasing adoption, improving performance, and optimizing investments in UC&C. Today we will discuss the big 4 KPIs for usage and adoption.
Usage and Adoption: Two Separate Battles for an Enterprise
First, a word about adoption and usage and the difference between the two. We define adoption as the percentage of people actively using a given resource. Usage is the amount or level of use of such a resource. To illustrate why this distinction is important, think of this example: a company can have great usage, but poor adoption because they have a small percentage of people using the technology a lot. This may be great return on investment for those few users, but companies need widespread usage AND adoption in order to increase productivity, reduce travel, and experience true digital transformation.
The Word in Adoption: Active Users
Okay, so that’s really two words. Point being, when you view adoption as the level of penetration a resource has achieved, the metric for adoption is clear — active users. You can measure active users as an absolute count of users or as a percentage, but if you express it as a percentage, make sure you divide by the number of potential users, not your entire employee count. Most of the time, companies don’t purchase licenses of any given technology for the entire workforce, so dividing by total employees is misleading.
An important note: you need to define for yourself what “active” means. For most customers, we define active usage as at least one usage per the monitored time period. Usually, the default time period is one month. So, an active user is someone who uses the resource at least once a month. You may want to set other limits such as at least X hours per month or X calls or meetings per month.
Companies often start with adoption overall, and then break it down by communication type (AKA modality), technology (vendor), and even by location or department if possible. Vyopta helps companies take this even further by integrating with systems like Exchange or Active Directory to help automatically tag users and rooms and then allow users to create reports and filters based on these tags.
Usage… Has Layers
Usage, however, has multiple layers. You can measure usage in a number of ways, but here are three that are typically used together to give a full picture.
- Minutes: To be as clear as possible, most organizations use participant minutes, or the amount of time their human resources spend in calls, totaled up across all humans in the desired grouping. There is also the option of meeting minutes, AKA host minutes. This would be the amount of time meetings took place if only the host was counted.
- Sessions: Sessions are a useful metric because they represent the connections between people. You can also break sessions down by modality, and you would call audio and video sessions “calls.” We use sessions because it is easier to maintain a single constant metric across all forms of communication. It may be important to note that a video call is also inherently an audio call, yet an audio call is NOT a video call. Think of how a square is a rectangle but a rectangle is not a square. The two things are kept separate from a reporting perspective because most companies use different technologies, networks, infrastructure, and providers for video than they do audio (although this is changing). And a chat or sharing session is neither audio nor video, although it may accompany both. Most companies want to measure audio or video calls, but keep chat and sharing totally separate, and we think this makes sense.
- Meetings: A third key metric for usage is meetings. This is mostly because having a session with multiple people requires special technology like bridging or group chat. One thing to note is that most meetings today support all formats at once, including chat! Meetings can be difficult to monitor with the reporting tools that come with technologies because they don’t group calls to the same destination at the same time into meetings. Vyopta does this automatically as part of our nightly data merging and cleanup operations. Without this kind of cleanup, it becomes very difficult to track meetings at all. This is important because multi-party meetings represent the best kind of collaboration – people joining from multiple locations instantly, without having to spend time or money traveling to see each other. Meetings represent savings in real estate, airfare, and productivity because participants can join from the most cost-effective location available rather than having to be physically collocated.
- Meeting Size: Tracking meetings also opens up the prospect of tracking collaboration stylistically as well as quantitatively. Vyopta provides you with the average number of participants on any given set of meetings (and we are working right alongside manufacturers as they enable technologies to count participants within a given meeting room). More isn’t necessarily better, but it does give you a window into how your company tends to collaborate, which in turn can help you direct your future UC&C investments.
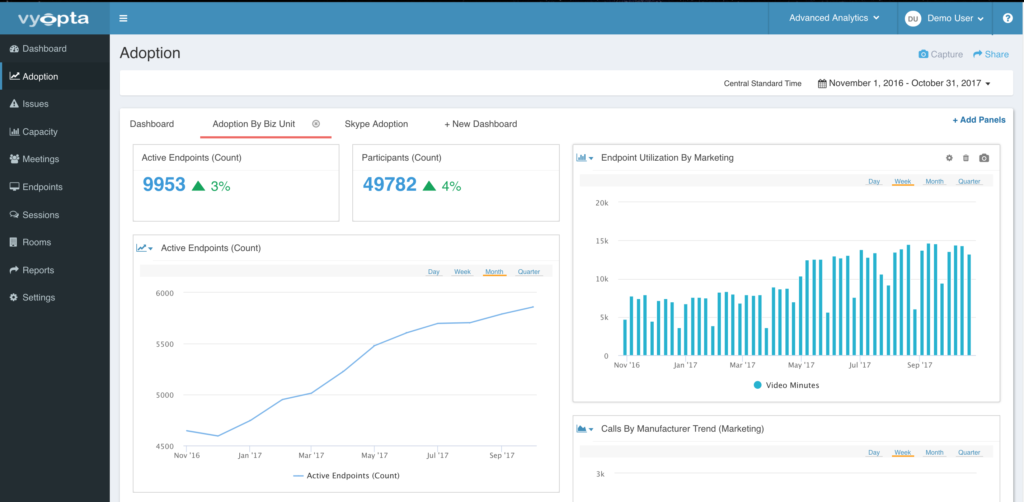
Sample Adoption Dashboard
You will likely find it both easy and useful to measure usage separately from adoption because, well, there are layers within the layers. For example, you can track audio minutes, video minutes, and chat sessions as separate, quantifiable activities. Knowing that one or another of these modalities is heavily used (especially when broken down by team or department) will help you discern how best to support and enable productivity most effectively. (And yes, Vyopta can help you distinguish between users who are active in video, audio, chat, just one, or all three.)
Next Steps
So there you have it! These are the key metrics hundreds of the world’s leading enterprises use to define usage and adoption and the reasoning behind them. Stay tuned to future benchmarks, insights, and best practices to help you accelerate growth for all of these metrics.
In the meantime, can also take a tour of these metrics in our free online demo.