It happened. You finally got that funding you’ve been after for that great technology deployment or refresh you’ve been pushing for. You’re all set to make your case for why it was the best decision ever. You sit down to put together the report to end all reports that’s going to elevate you to UC Super Hero status around the office, and then…crickets.
Unless you have visibility into how and when your technology is being used, it’s kind of hard to make the case for the value that it’s providing. We polled UC engineers like you and asked them the burning question that’s probably on your mind right now.
“What does your boss actually care about?”
Tiny disclaimer here: we don’t know your boss. Or even if we do, this guide is meant to provide a starting point when providing visibility into the health of your UC environment. So here we go.
Does it work?
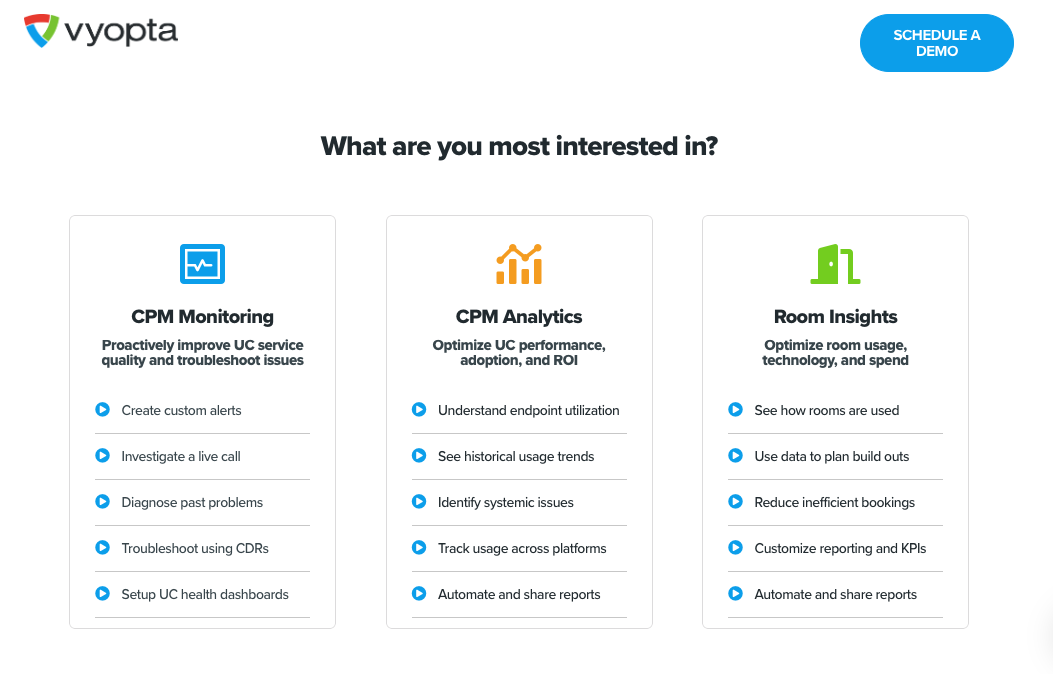
You may remember from our Collab Week Silicon Valley recap a session NoJitter contributor Irwin Lazar gave on UC by the numbers. If you missed it, don’t fret. You can check it out here. Irwin touts as the first measure of success, “Does it work?” and we tend to agree. In fact, many of our customers including those polled listed monitoring real-time call quality as a key reason they use Vyopta. In addition, they use historical analytics to report on how well the technology is working as well as on the overall health of the UC environment so that when something isn’t working, they can address it right away.
Is anyone using it?
100% of the respondents in our informal survey touted adoption as one of the key metrics they’re measured on. While it can be difficult to piece this story together via the data that’s available in multiple tools, this is a key metric that users of Vyopta’s CPM Suite note. One respondent claimed pulling the data individually took his team 100x longer than a single report in Vyopta, so we hope he got some kudos for greatly increasing the efficiency of his team on that front.
What’s the business value to the company?
So you know the tools you’ve deployed have brought a huge amount of value to the company. Now you’re ready to re-up on the contracts. With visibility into how the technology performed, you can start out negotiations from an informed position, once again providing value to the company.
Year-Over-Year Growth
As companies continue to invest millions to billions of dollars on their collaboration environments, understanding year-over-year growth of video collaboration is a key driver.
Did we capture the metrics that are most important to your boss? If you’d like to see how you can get more visibility into your UC environment, check out our guided tour.