Collaboration space is a Big Problem, and not the way you think
Most people think of conference rooms only when they are trying to book one last minute and they find out there aren’t any left nearby. However, the problem is actually the opposite: conference rooms and collaboration spaces are usually underused. According to The Workplace Productivity Index put together by Teem, the average conference room is only 33% utilized. In general, Rifiniti claims that 50% of ALL office space is underutilized. Companies are trying to fix this problem by overhauling their locations to make more open work spaces and smaller collaboration rooms, AKA Huddle Rooms.
The cost of rooms
Right now, most estimates place the number of conference rooms in world at around 60 million. At best guess, about 2 million of these rooms have video conferencing. The number of rooms is expected to double in the next couple of decades and the number of video enabled rooms is expected to exceed 10 million in the next 5 years. Just for fun with numbers, the rate of a commercial lease is $8 per square foot/month. An average conference room is about 100 square feet, so that means $9600 per conference room, per year, just in real estate. This doesn’t include overhead or equipment/furniture. Putting all this together means there is about $5,000 – $7,000 spent on conference rooms that is wasted every year (depending on whether you use 33% or 50% as your metric for utilization).
That is a lot of money, and it is an even bigger problem for the future as conference rooms and collaboration spaces become important to companies who want flexible, distributed teams that collaborate even more than they do today.
What can you do about it?
The real problem is that nobody really knows how to fix this utilization issue. Should we make more rooms? More desks? Should we make less “rooms” in favor of open areas? How are my employees actually using the space in offices that have not been updated versus offices that have? How does a room’s usage change when I install new technology like video conferencing and interactive whiteboards?
There have been a few choices for companies looking to solve this problem, and they all have issues.
- Consultants will come in and survey your users and study their activity via in-person observers or through cameras. This is expensive, only helps at one location, and the way people use space depends on a LOT of variables.
- Several companies offer customized tablets, software, and cloud applications that also function as room signage. However, this is also expensive, AND User behavior has to change to manually sign in to meetings and book them via these devices.
- Other companies rely on WiFi access point data to estimate user location, but this doesn’t tell you what users are doing or if they are actually in the room or just nearby.
- Finally, you could install sensors and cameras in each room or office area. This is (again) expensive, requires some expertise and software to interpret the data.
None of these options are working today, so we decided to look at what data was available today to solve this problem, and guess what? We had a great idea!
Workspace Insights was born
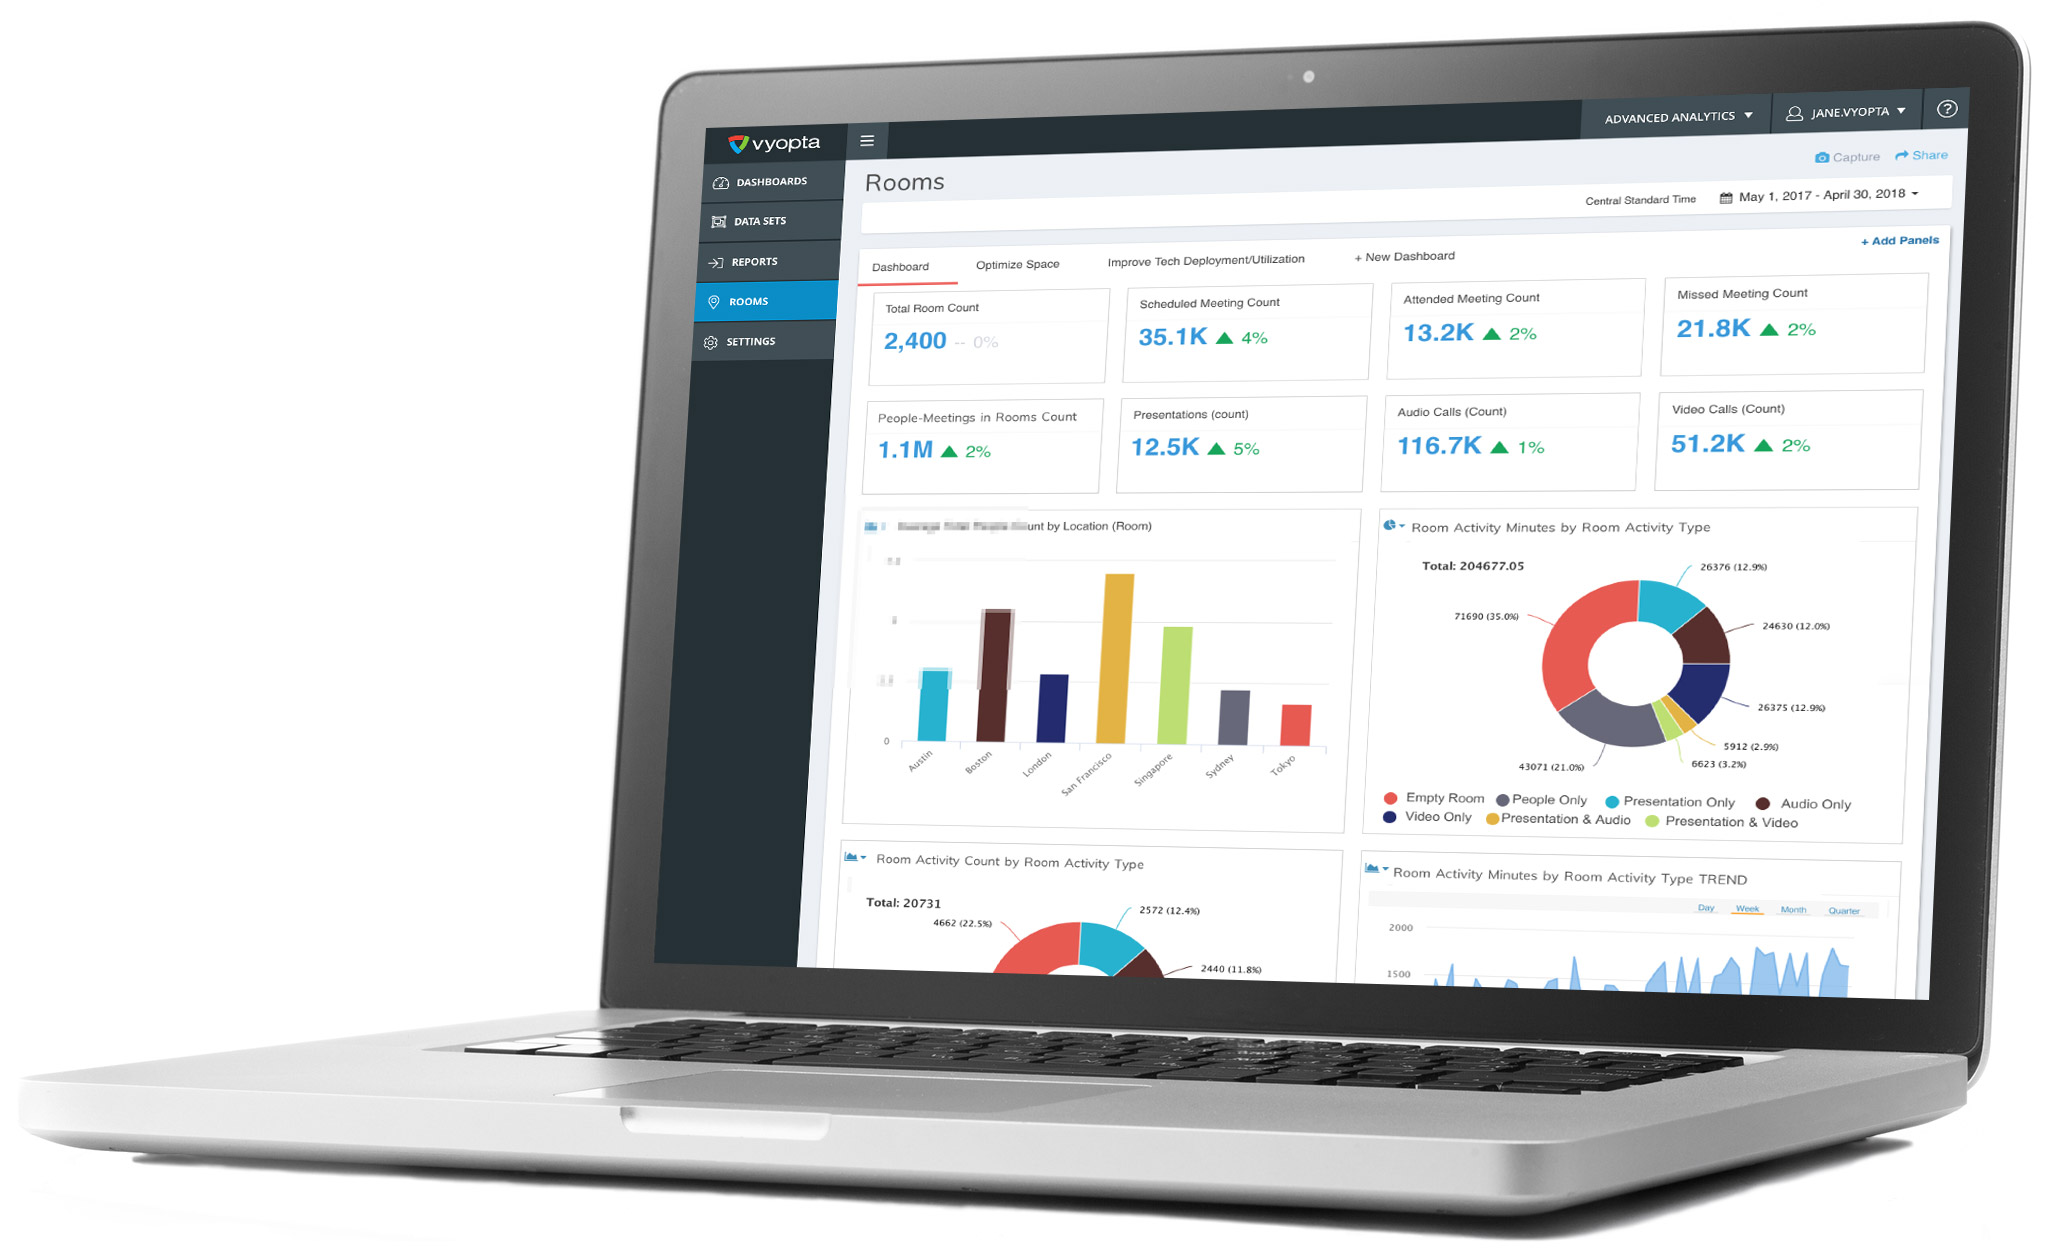
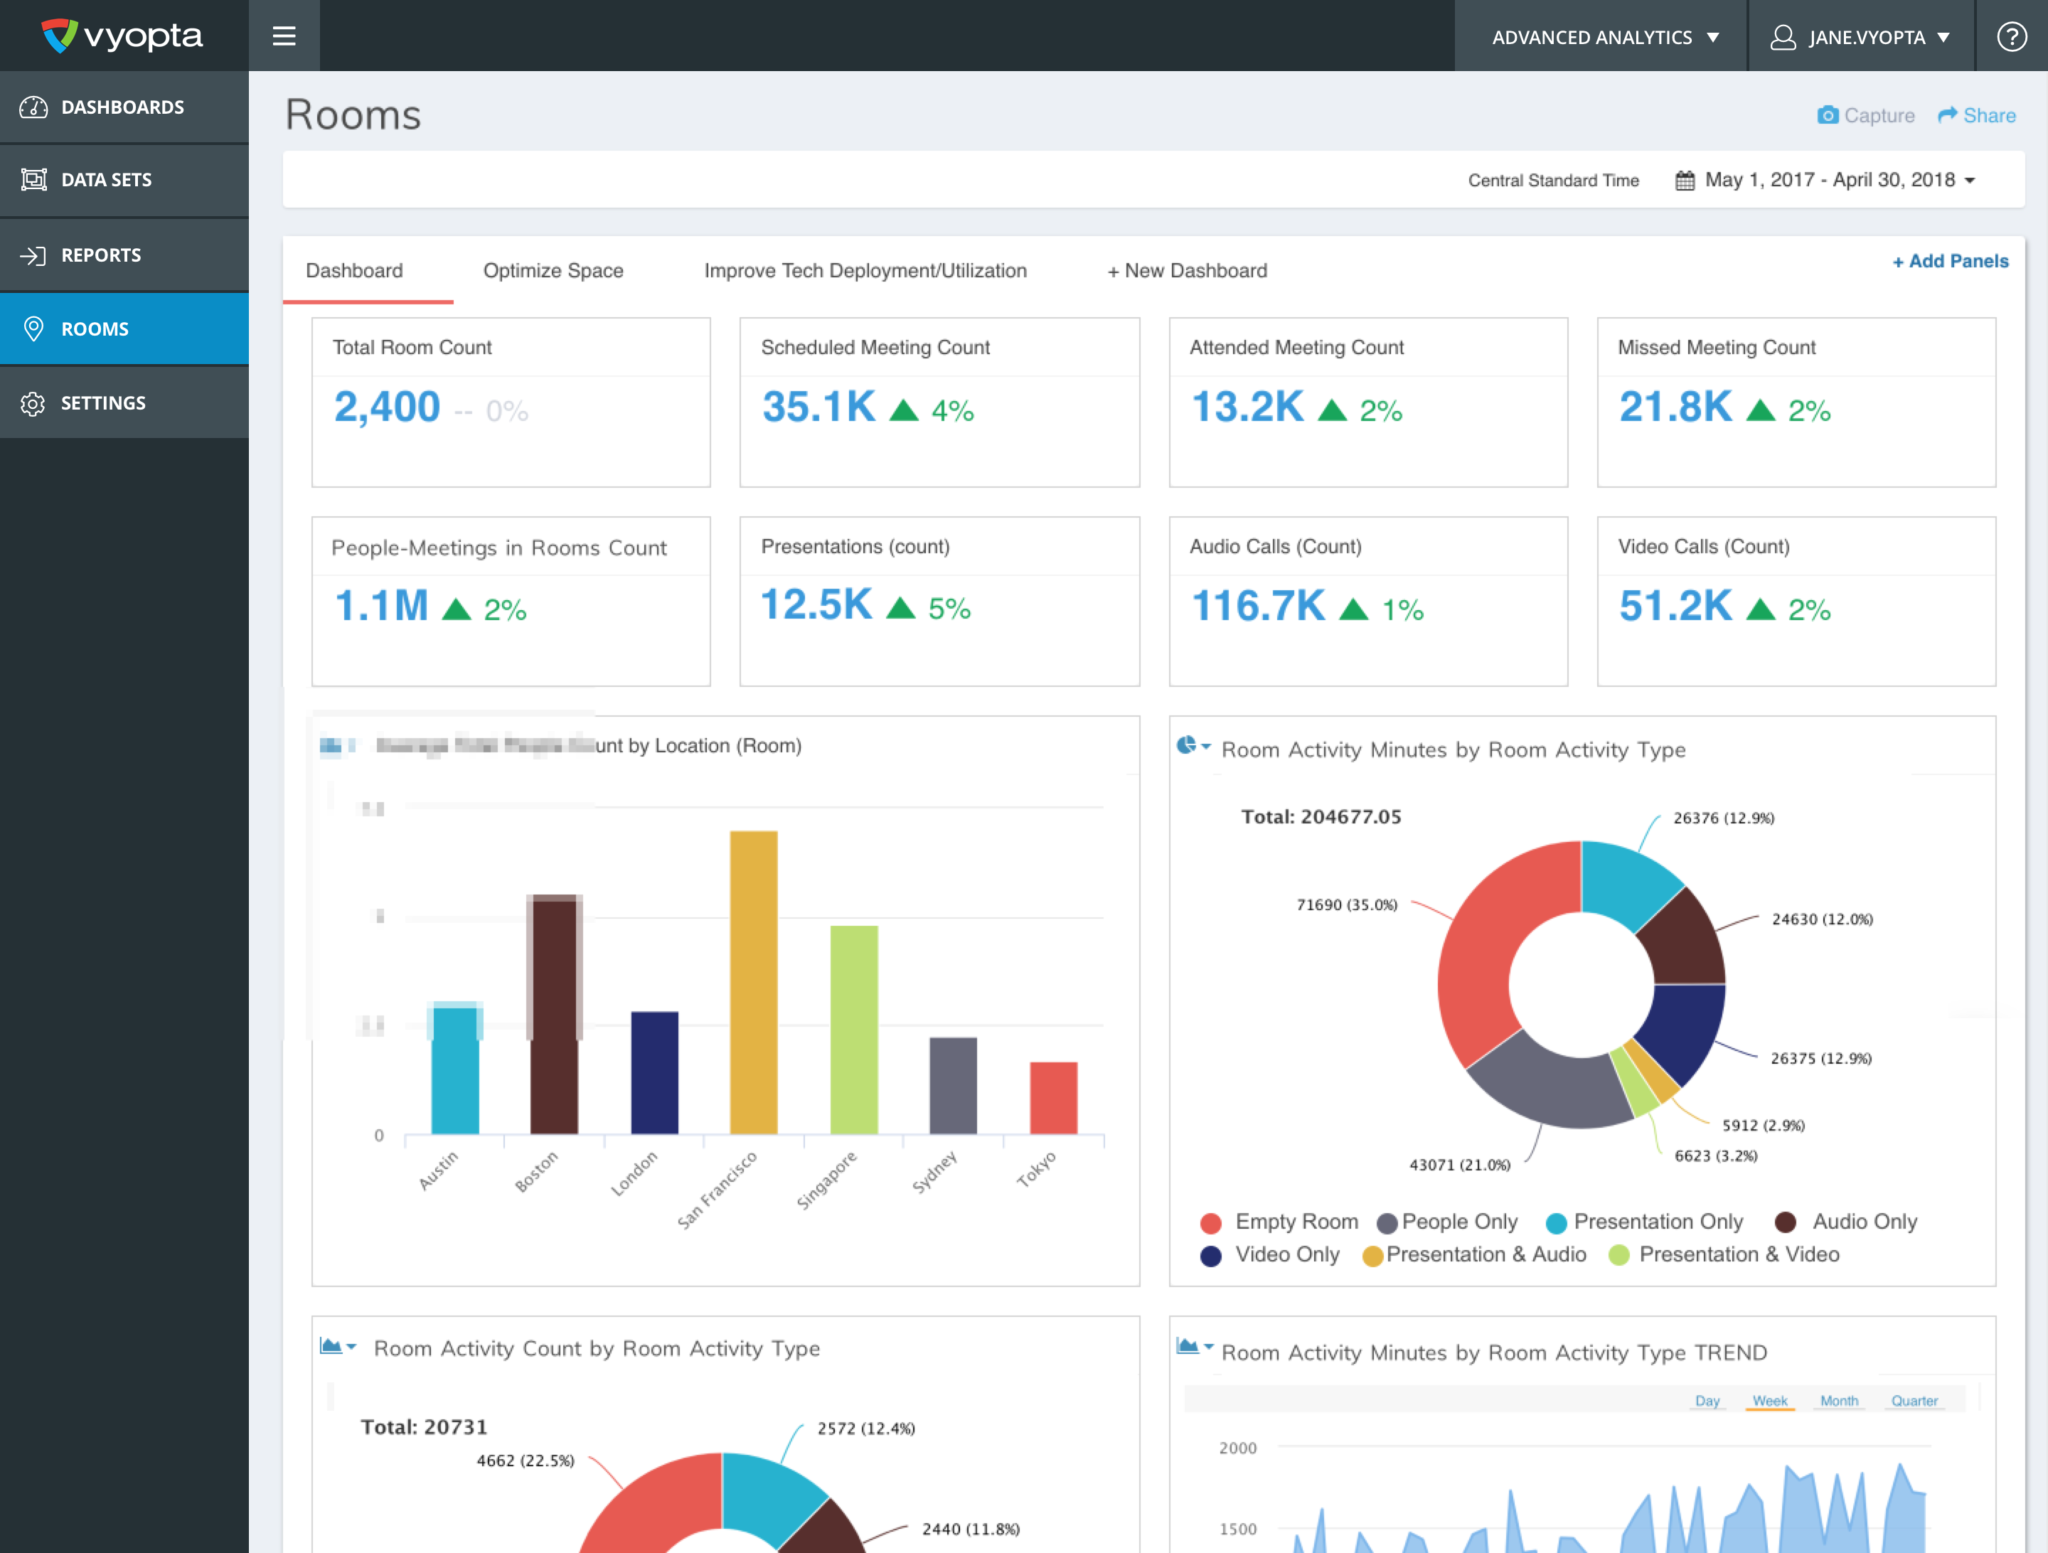
To solve the big conference room dilemma, we created Workspace Insights. Workspace Insights tells you how much all your rooms are used, what they are used for, and who is using them. We applied our analytics engine and data collection expertise to do a few things.
- We are expanding the data we collect from conference room video endpoints to include video, audio, presentation, and even facial recognition (people count) information.
- We also added integration with Exchange/Office365 so that you can compare in-room activity with scheduling data to find out if people are actually using the rooms they book.
- Finally, when you combine both of these sets of data with our ability to connect business information about location, department, room capacity, and other information – you really get a great picture about what is happening in your conference rooms.
So What Can I do with these Insights?
We have built a few standard insights so far, and when this product leaves Beta phase in Q3, we hope to have a few more. Here are some of the main metrics we can show you today.
- Quantity of Ghost Meetings (booked, yet zero attendance) by Room and by Host
- Room Activity by Type (Video, Audio, Presentation, Empty, or In-person*)
- Inefficient Meetings (People Count is <20% of total capacity) by Room and Host
- Endpoint Utilization
- Custom tagging and data integration services to group rooms by office, type, model, location, floor or any other item
- Scheduled, Attended, and Missed meetings by Host and Room
Practical Use Cases
In practice, there are several key problems you can solve with interactive, powerful, and accurate insights like this at your fingertips.
- Understand conference room usage by site and room type to make better decisions with Facilities and HR around how offices should be set up.
- Change user behavior to stop booking large, well-equipped rooms for small meetings.
- Identify and remove recurring Ghost Meetings and re-train those who book them consistently
- Find popular room and office configurations and replicate them in other sites
- Combat anecdotal evidence and emotional decisions with reliable data
For More Information
You can contact sales for a demo today, you can meet us an upcoming show like Cisco Live or Infocomm, or you can watch our recent webinar on Enterprise conference room utilization.
FAQs
We have been working on this for over a year with a few customers, so we have anticipated a few questions:
Q: What about rooms without video endpoints?
A: We still get scheduling information, so you can see how the rooms are supposed to be used.
Q: Will you be expanding data collection to other devices such as audio conferencing endpoints or interactive whiteboards?
A: While we don’t have specific commitments, we will definitely move quickly if the data for these endpoints becomes available.
Q: What about if I use the Google GSuite for my calendar and rooms?
A: We are in progress with that, since that is actually what we use here at Vyopta


