It’s no surprise that COVID-19 had a huge impact on UC as businesses moved from in the office to having their employees work remote essentially overnight. We’ve seen many of the eye popping numbers coming out of the UCaaS vendors, and we’ve all felt the growing pains for moving from meetings with a few remote participants to meetings that seem to have grown exponentially.
At Vyopta, we’re in a pretty unique position to be able to look at what’s going on across platforms and verticals and uncover just what COVID-19’s impact on UC has really looked like. The data referenced below is anonymized data from the Vyopta user base and includes cross-platform data.
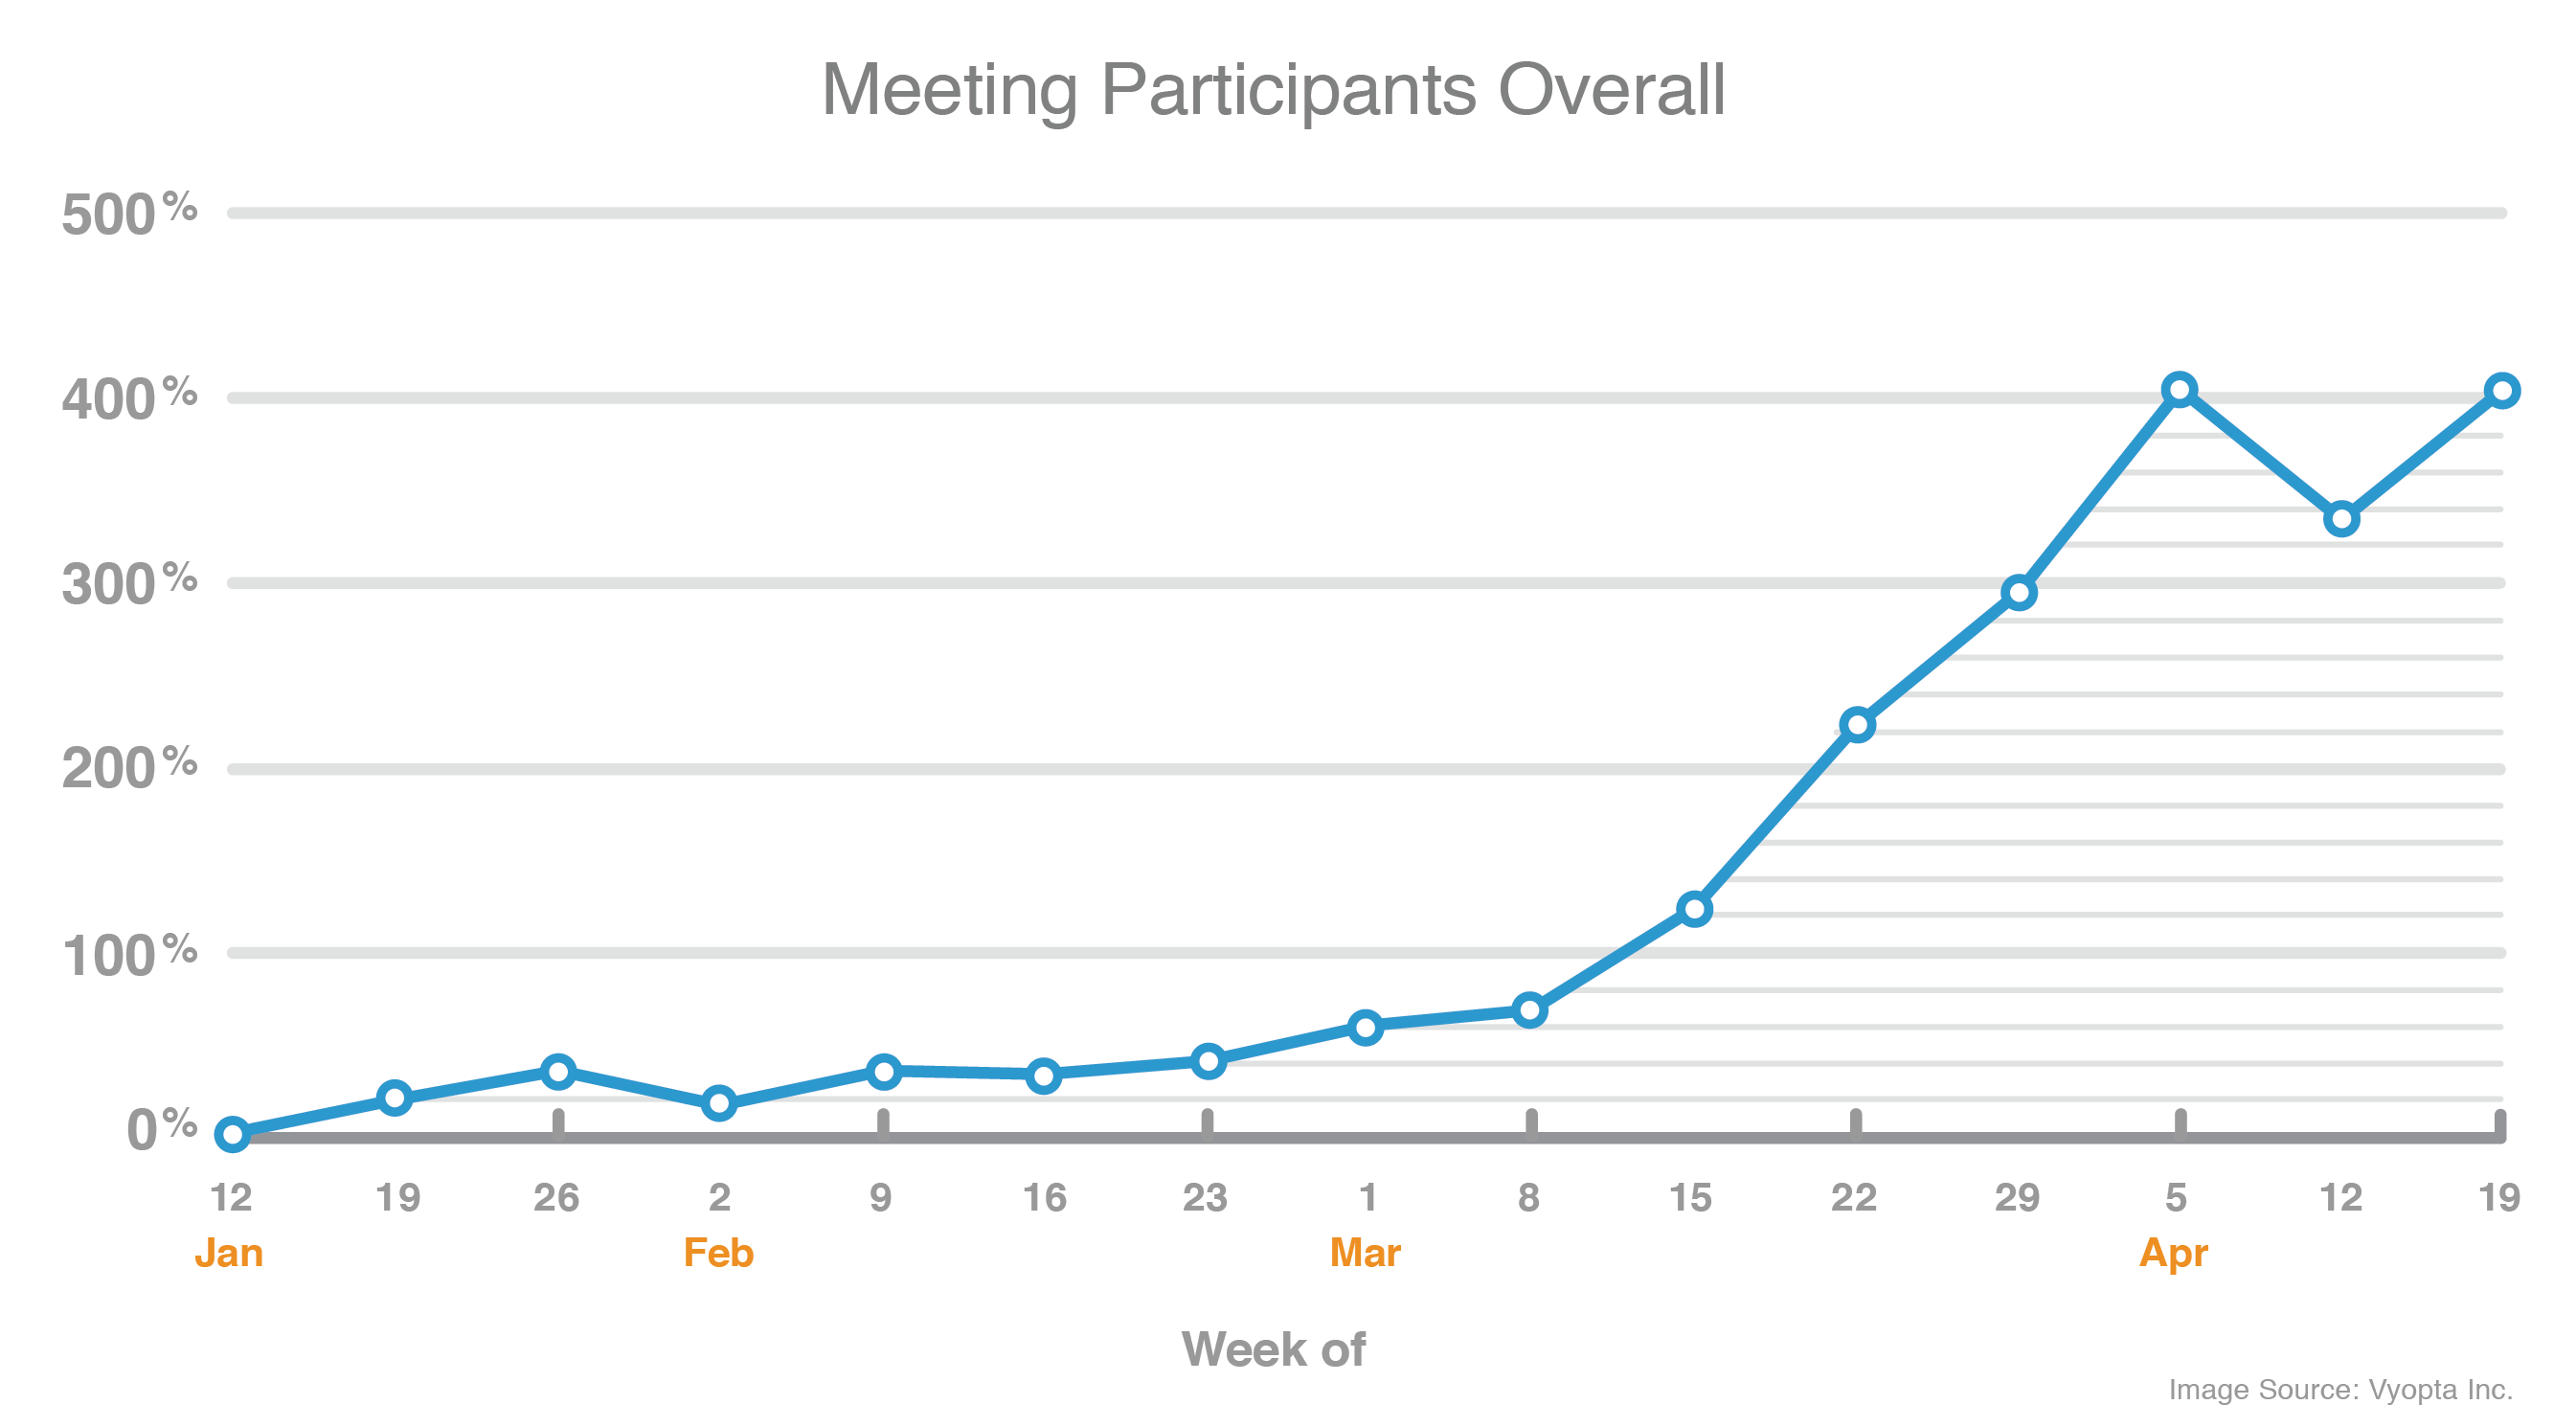
Meeting Participants
This chart shows pretty clearly, and not at all surprisingly, what happened when we were all sent home. The number of participants in meetings went way up as everyone was joining separately rather than most people in the same room with a few remote participants.
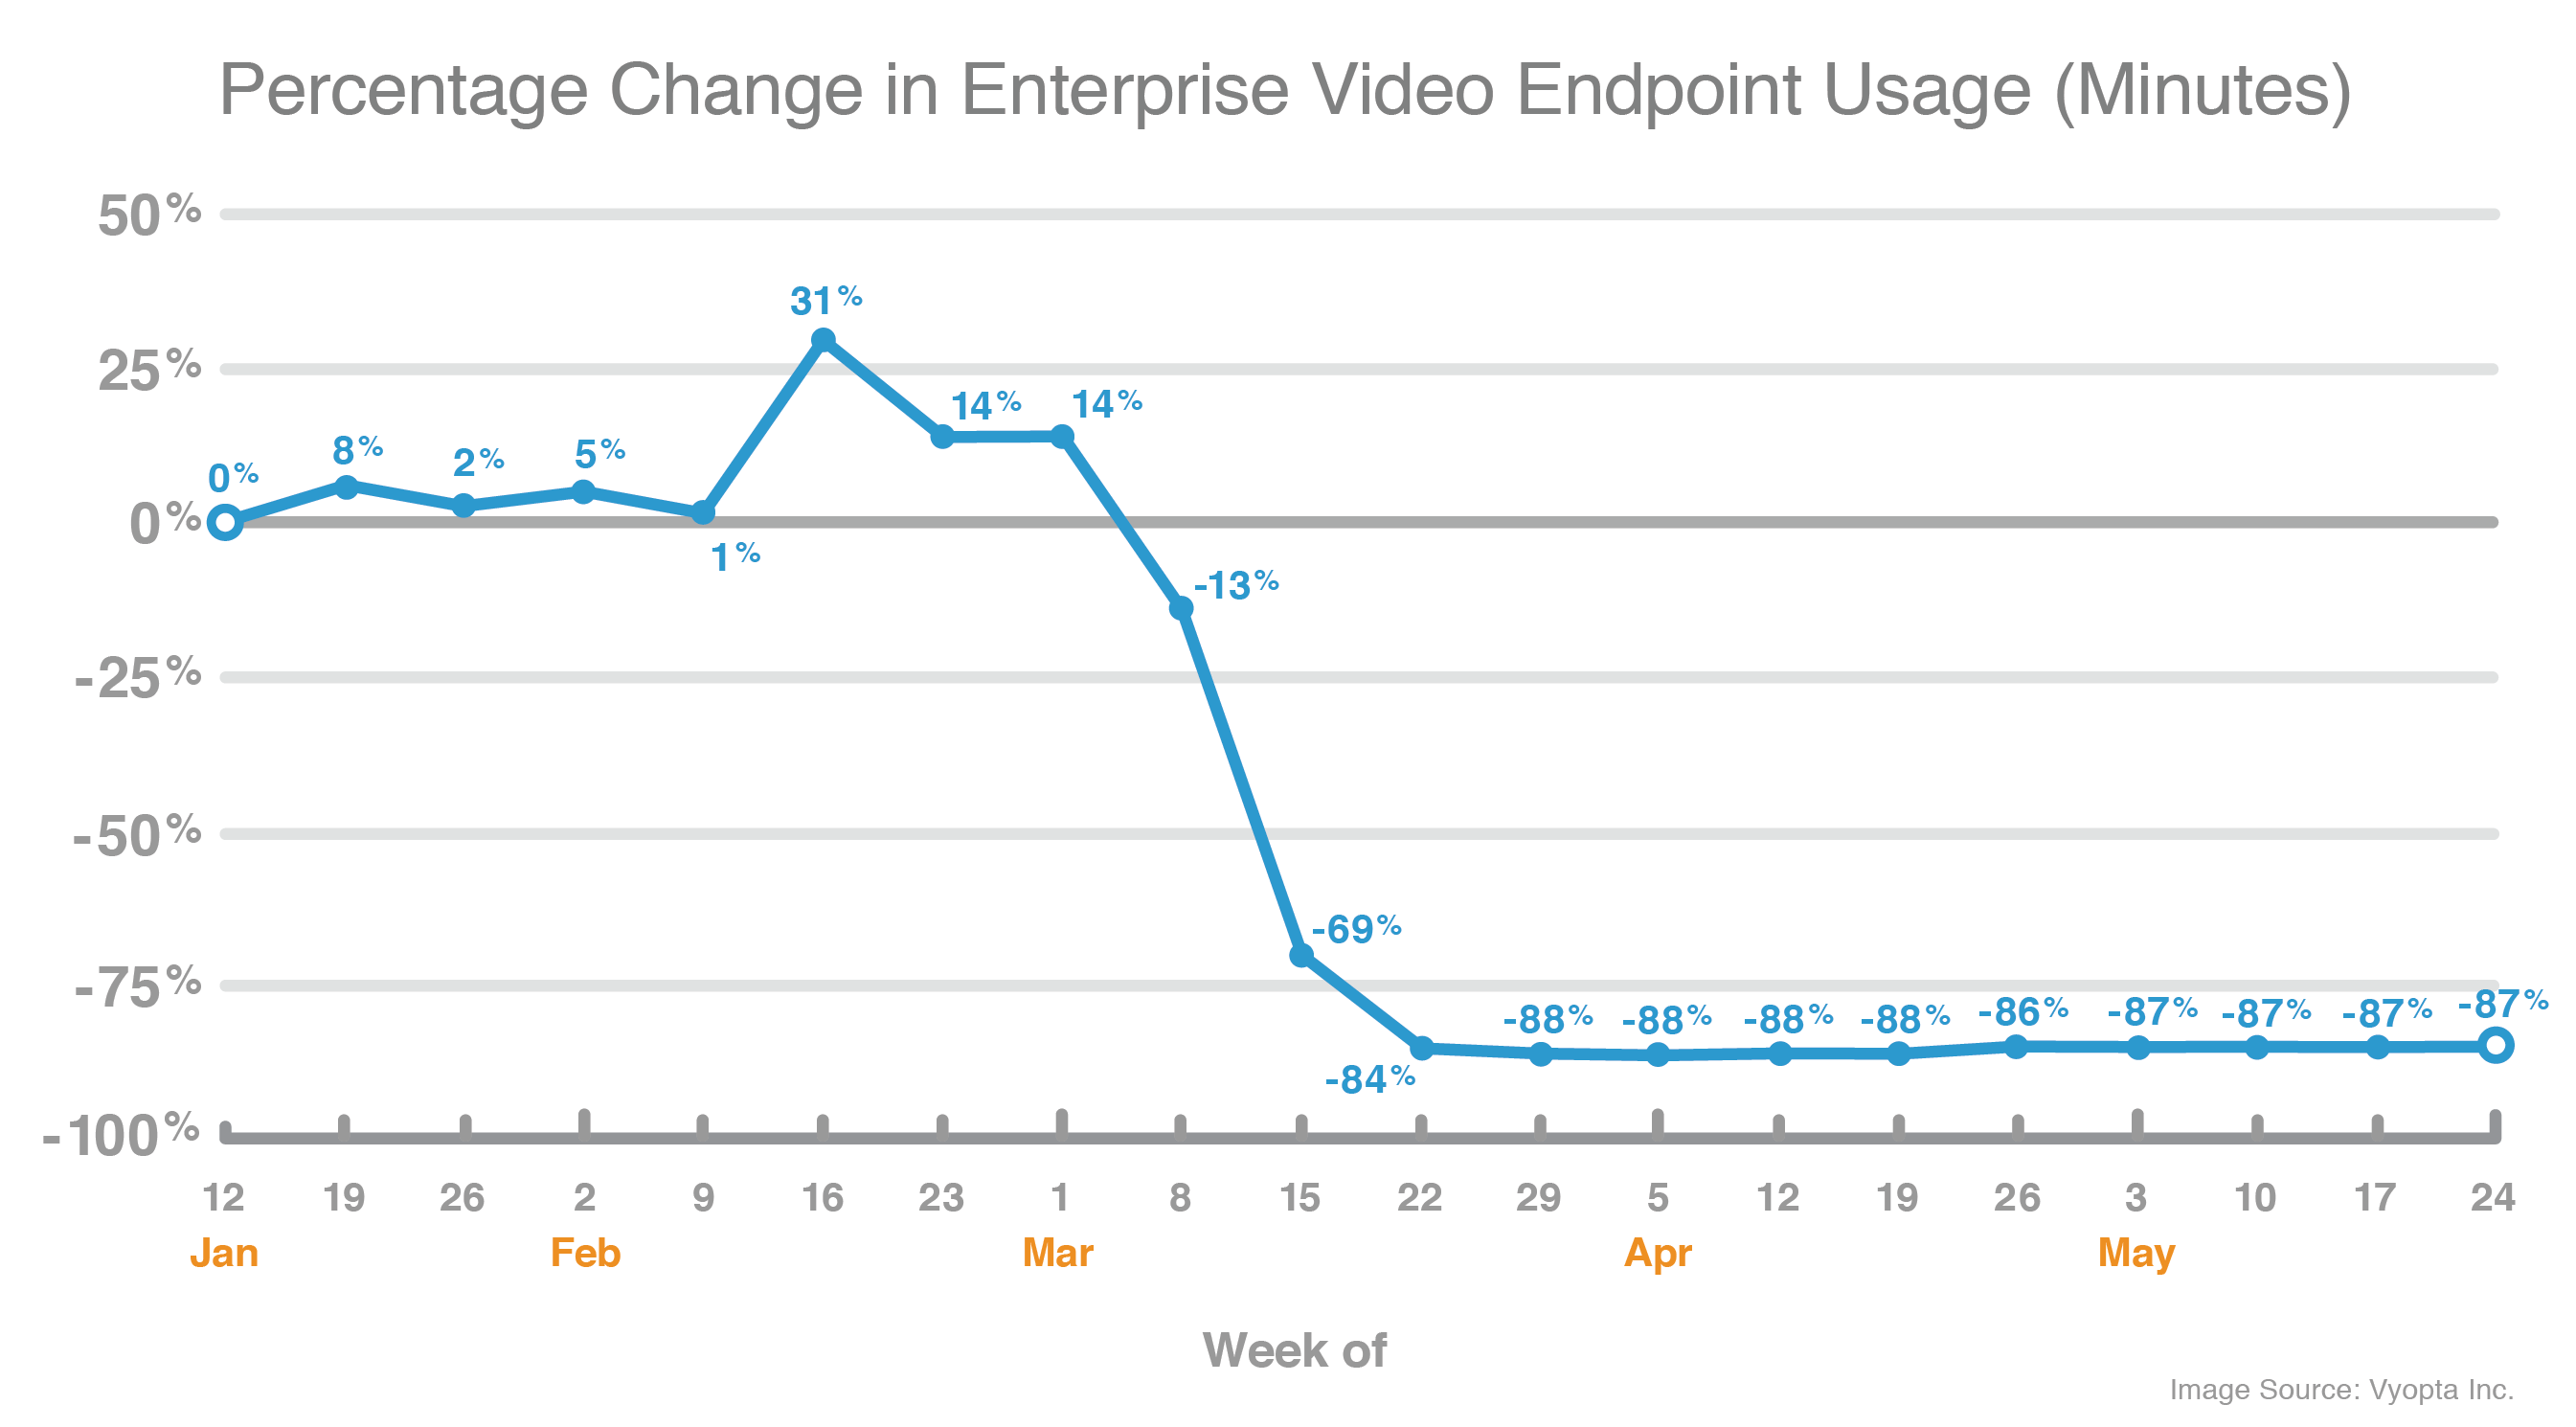
Endpoint Usage
Similarly, we saw a massive drop in endpoint usage as more employees moved to remote work.
While there was a slight uptick in endpoint usage in February versus January, the usage of these endpoints decreased significantly as the COVID-19 pandemic took hold and remote work and lockdowns were put in place.
Certain industries with essential workers (ex. Healthcare, Manufacturing, Pharma) saw a continued non-zero usage of endpoints after the pandemic took hold.
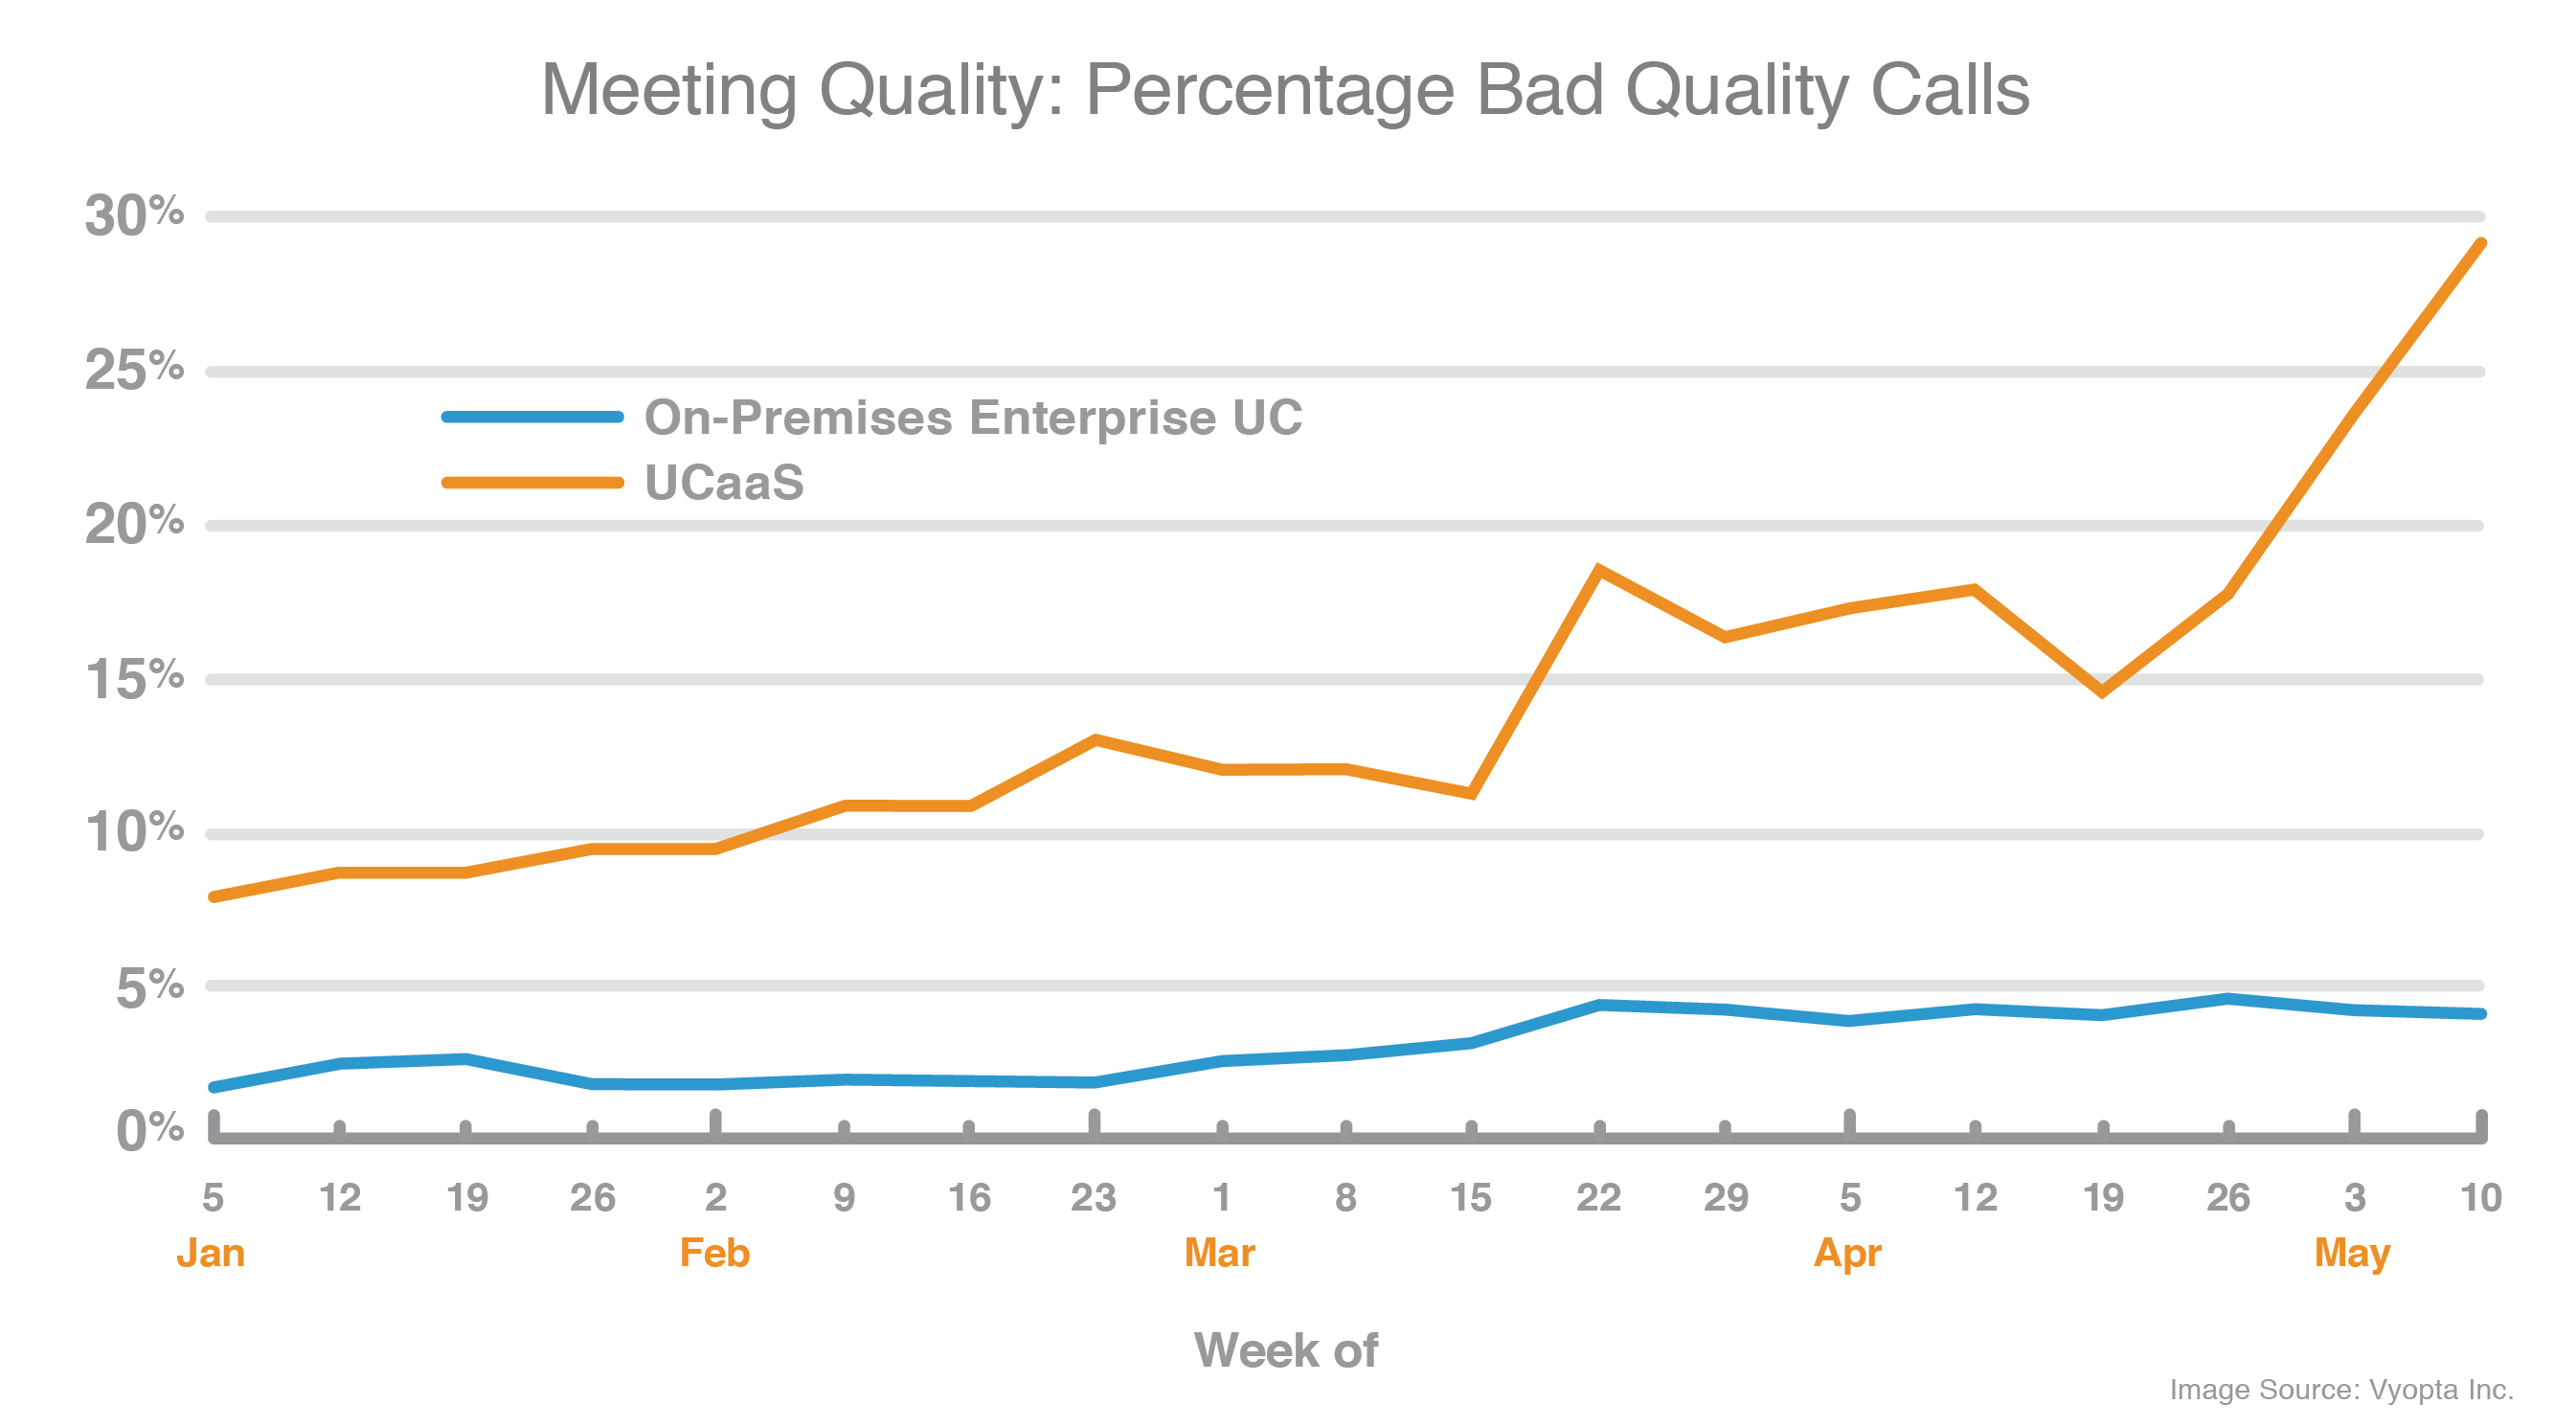
Call Quality
While all of that was going on, you can see a vast increase in call quality issues for the UCaaS vendors in comparison with on-premises collaboration technologies. The increase started in mid-March but has continued to increase significantly through Mid-May. This data on UCaaS aggregates data from platforms including Zoom, Webex, BlueJeans.
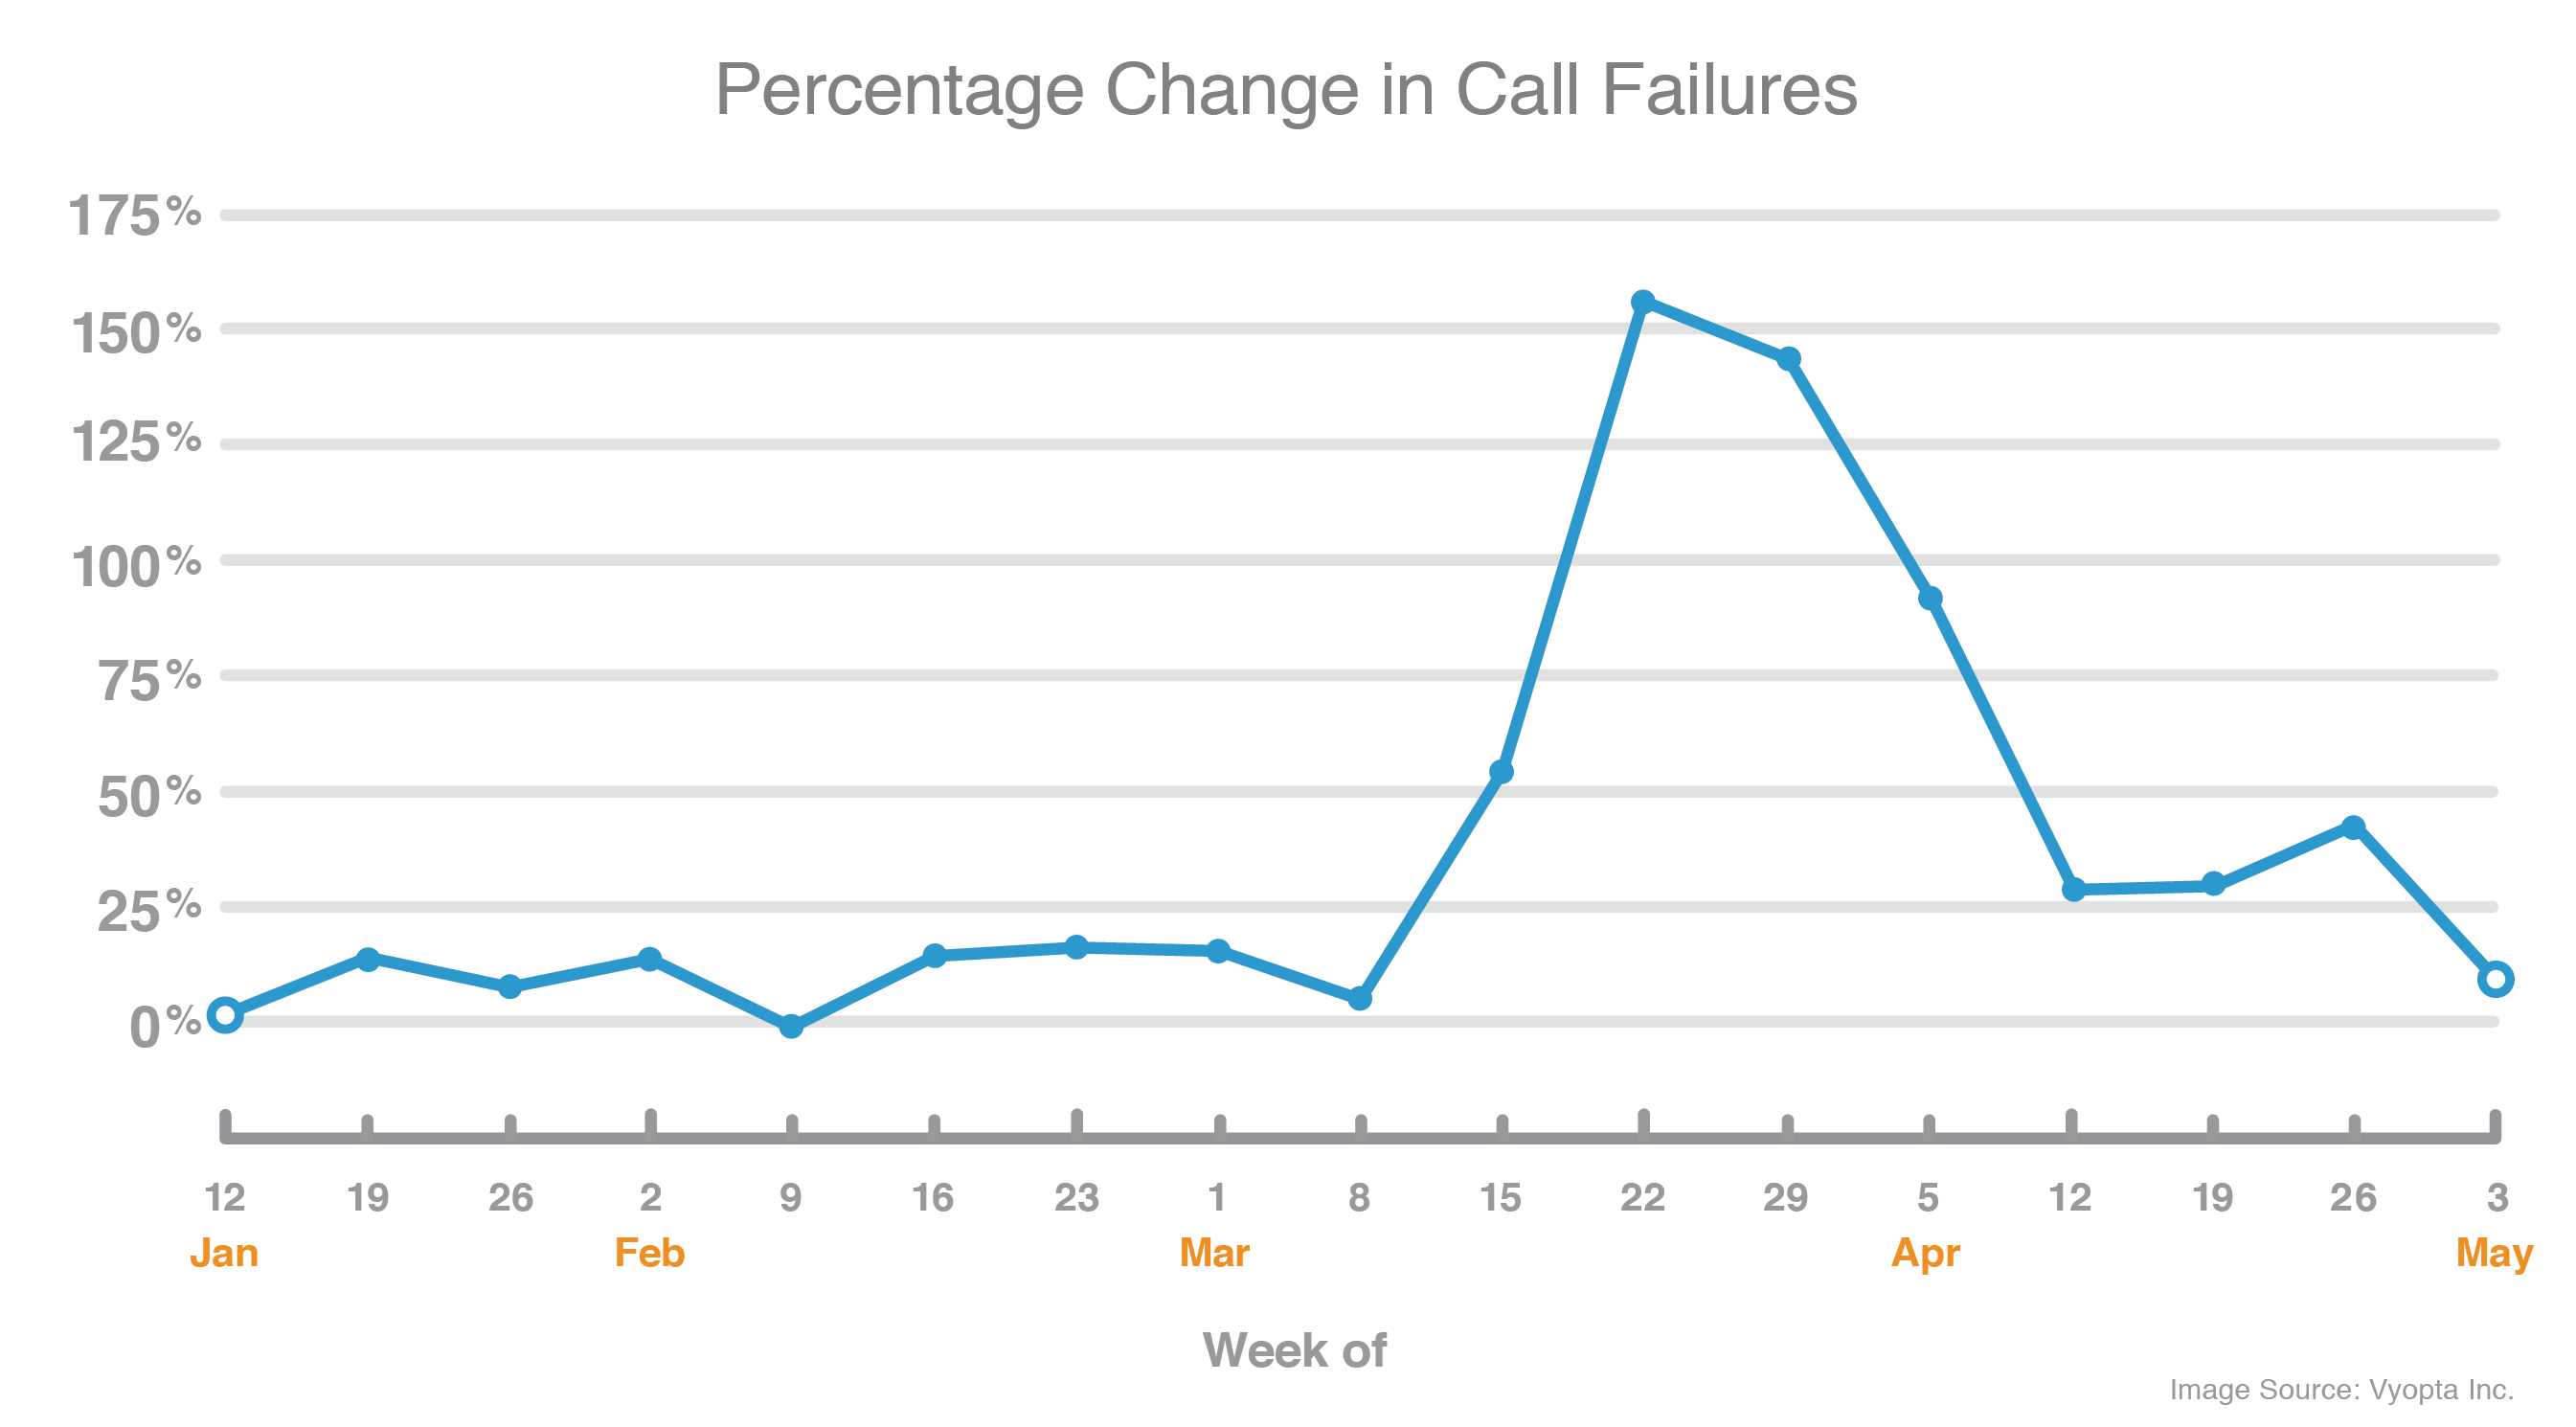
Call Failure
This chart is normalized to January and illustrates the growing proportion of call disconnects/failures compared to the increase in meeting participants since January.
The higher rates of abandonment indicate that a call dropped or user was disconnected and therefore had to call back in. Call failure vs call quality in the previous chart.
The large increase in March in abandonment rates likely indicates that enterprises, UCaaS vendors, and telecom providers/services had issues keeping up with the needed capacity to sustain the large surge in users. Organizations, vendors, providers are taking steps to address these issues, but it’s not in the all-clear yet
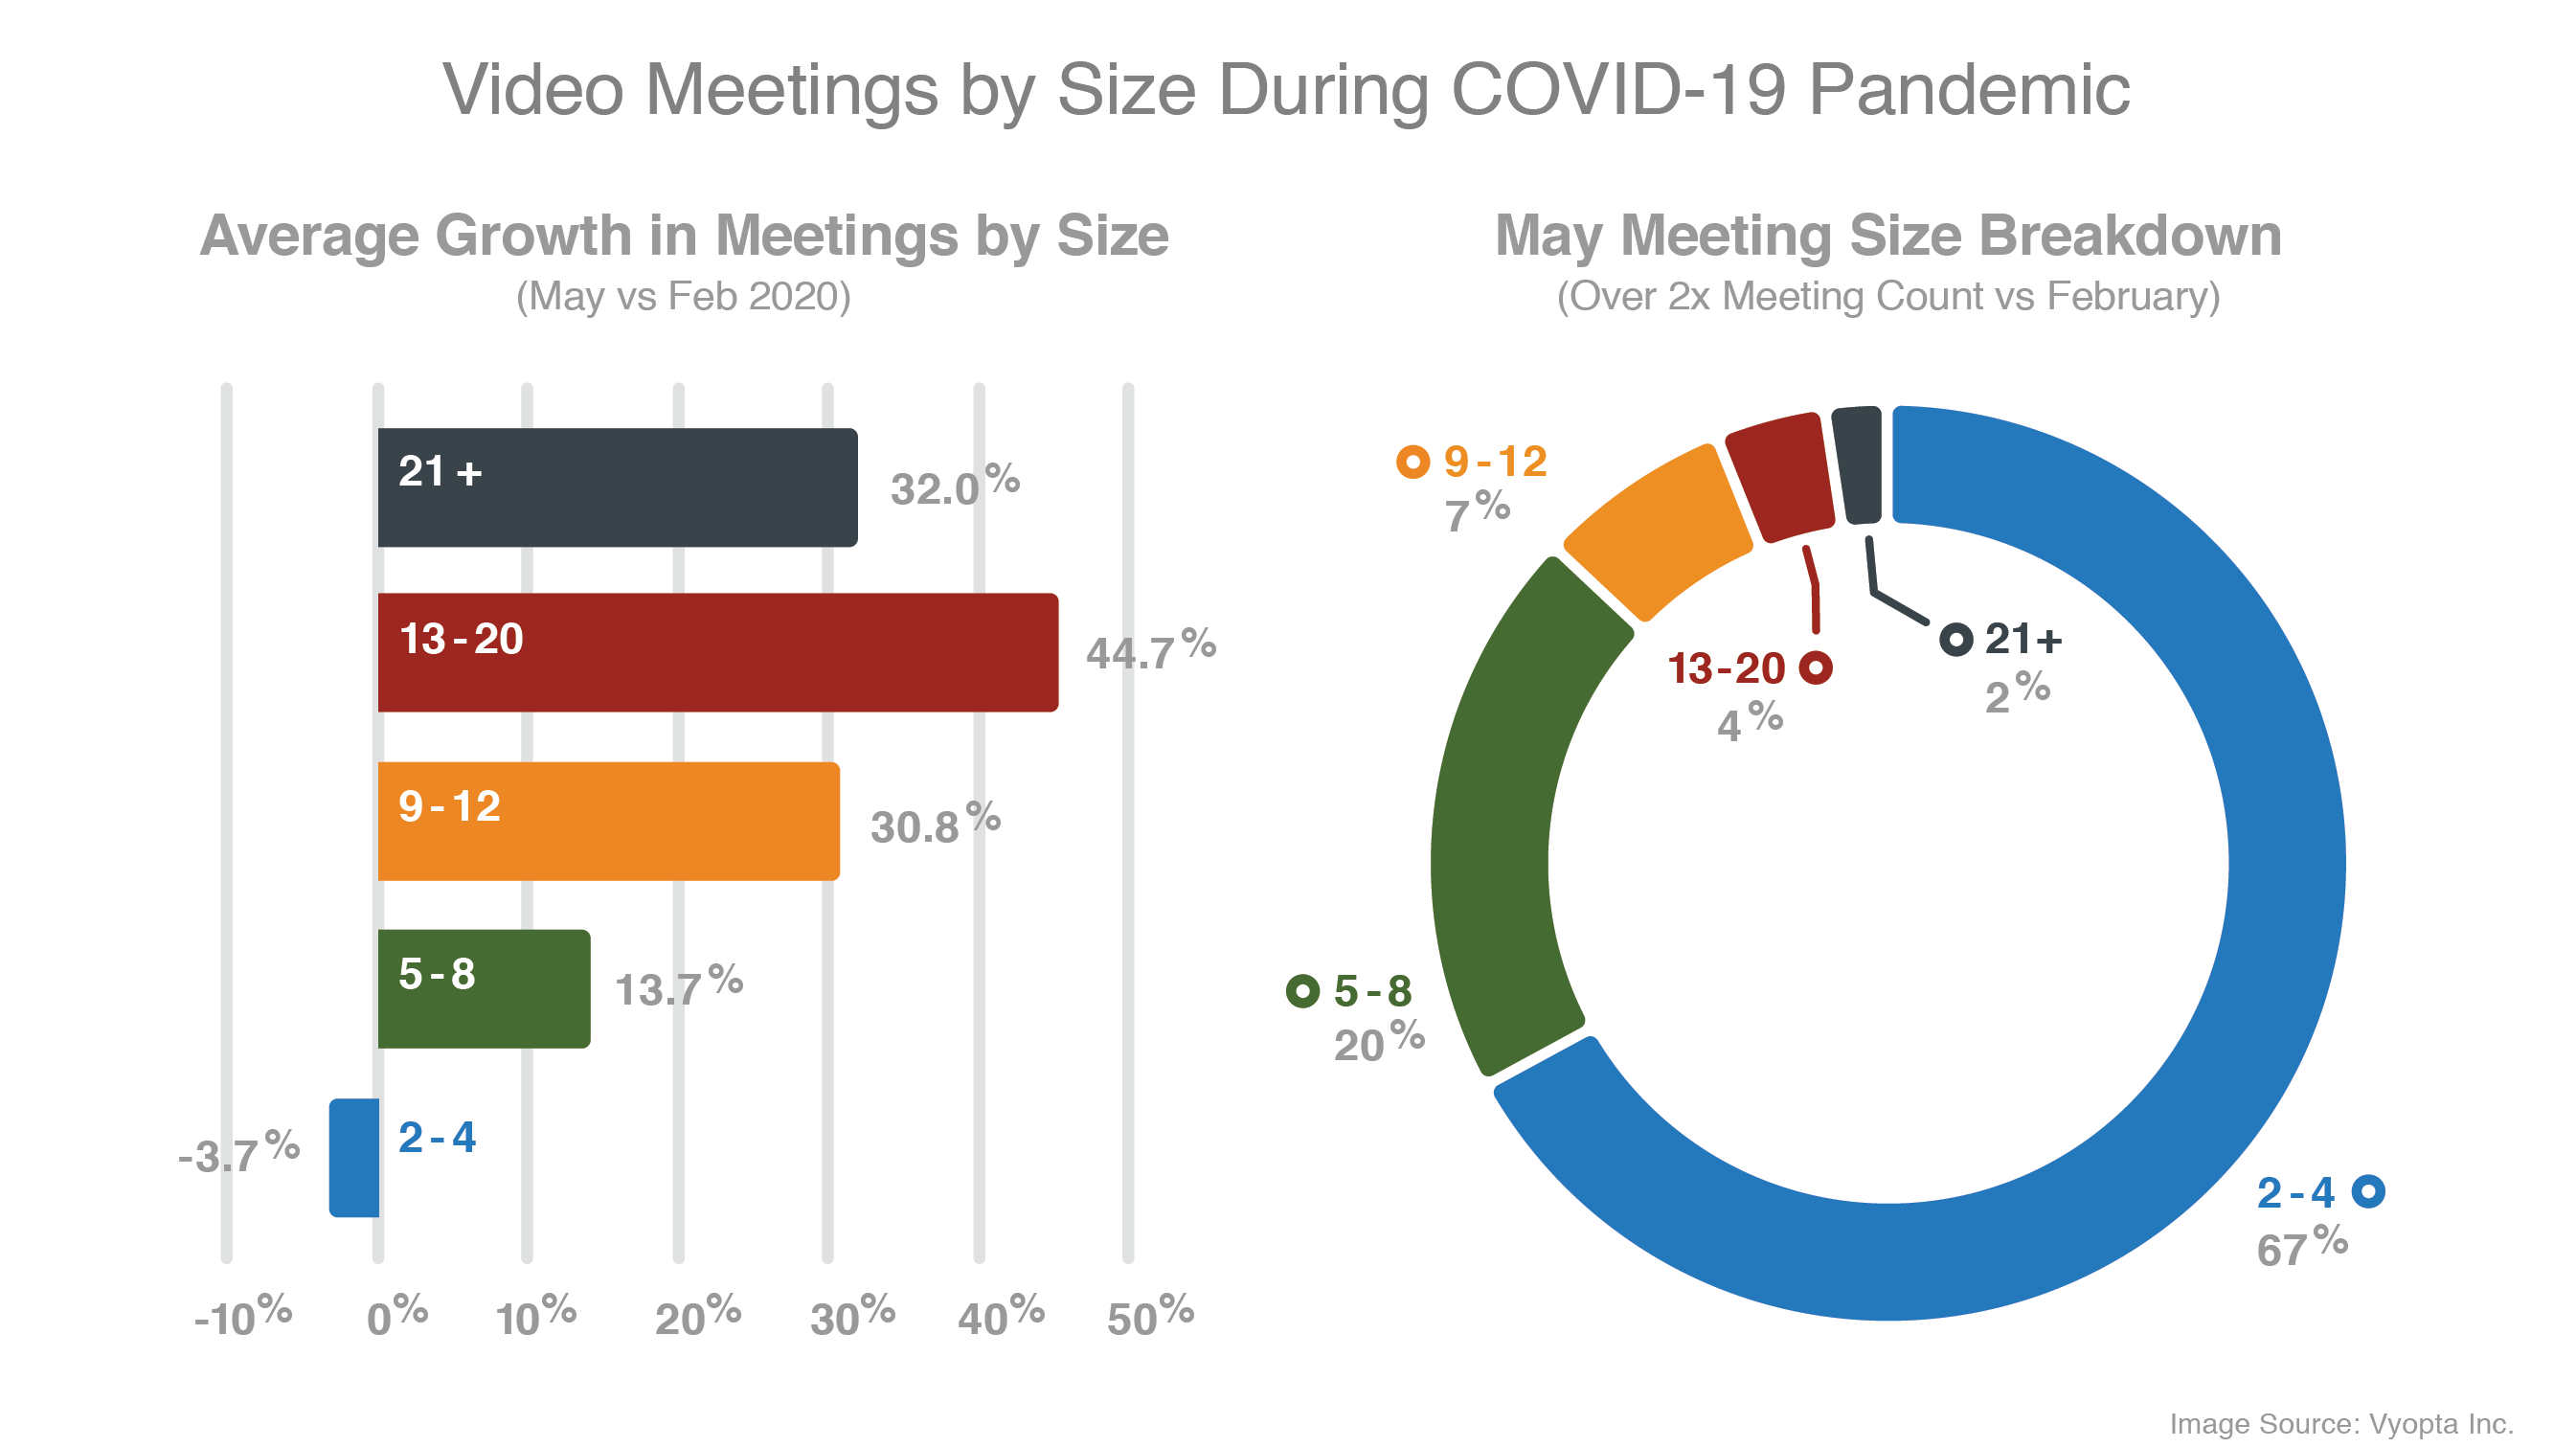
Meeting Size
Let’s talk about meeting size for a moment.
This chart data is normalized to mid February and shows growth in meetings since then by different size groupings.
There has been a definite increase in larger meetings. While the overall breakdown of meetings by size remains proportionally similar since before the COVID pandemic, there is a noticeable significant increase in meetings of larger sizes (which are also lower in number).
Smaller meetings under 5 participants have decreased slightly. This could be due to the fact that in the past multiple participants would join a single meeting from one device/room in the office, however, they are now all joining independently from their locations. The decrease is slight, and the overall proportion of meetings with 2-4 attendees is very high.
Meetings have grown in count over 2 x in the timeframe from February to May.
As part of our response to the Covid-19 pandemic, Vyopta is currently offering a free trial to help IT teams support massive expansion in remote work.

Angela Shori is a business writer and technology marketer with over 20 years of experience. She holds an M. A. in Advertising from the University of Texas and writes about unified communications, cloud technology, innovation, and the future of work -- sometimes through the lens of Star Wars. You can find her online at LinkedIn and Twitter.