


Adoption (Advanced Analytics)
The Adoption tab looks at usage data over time in order to identify adoption and usage trends.
OVERVIEW
The Adoption tab is a collection of dashboards in Advanced Analytics that features an abundance of adoption-related default panels as well as space for you to create additional dashboards, generate reports, etc.
The positive growth of adoption is a critical component to successful UC&C execution. Its focus is on highlighting when, where, and how your communications resources are being utilized within your organization.
DEFAULT ADOPTION PANELS
The Default Adoption panels are designed to give you a comprehensive overview of the adoption trends and critical statistics within your organization, based on Vyopta’s experience with hundreds of customers. The idea behind these particular default panels is to enable you to track adoption rates and usage over time to gain a sense of where your users are utilizing your UC&C platforms, and how.
Endpoint Utilization Trend
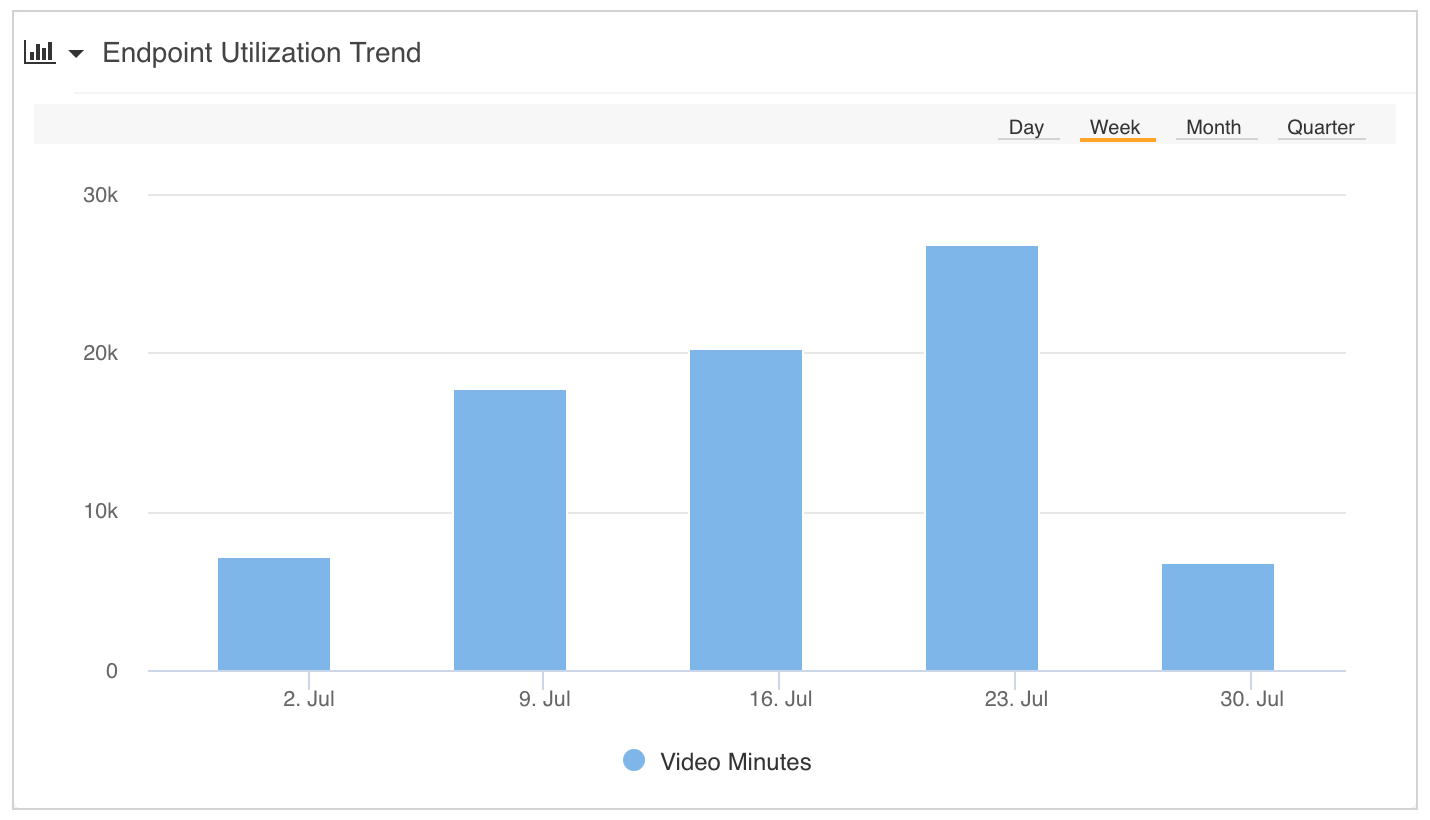
The Endpoint Utilization Trend panel represents minutes of video communications across your UC&C network over a given period of time, a basic, but meaningful gauge of adoption levels.
Panel Settings
|
Option |
Setting |
|
Category |
Managed Endpoint |
|
Metric |
Video Minutes |
|
Group |
No Grouping |
|
Display Type |
Bar Trend |
Bridge Usage Trend
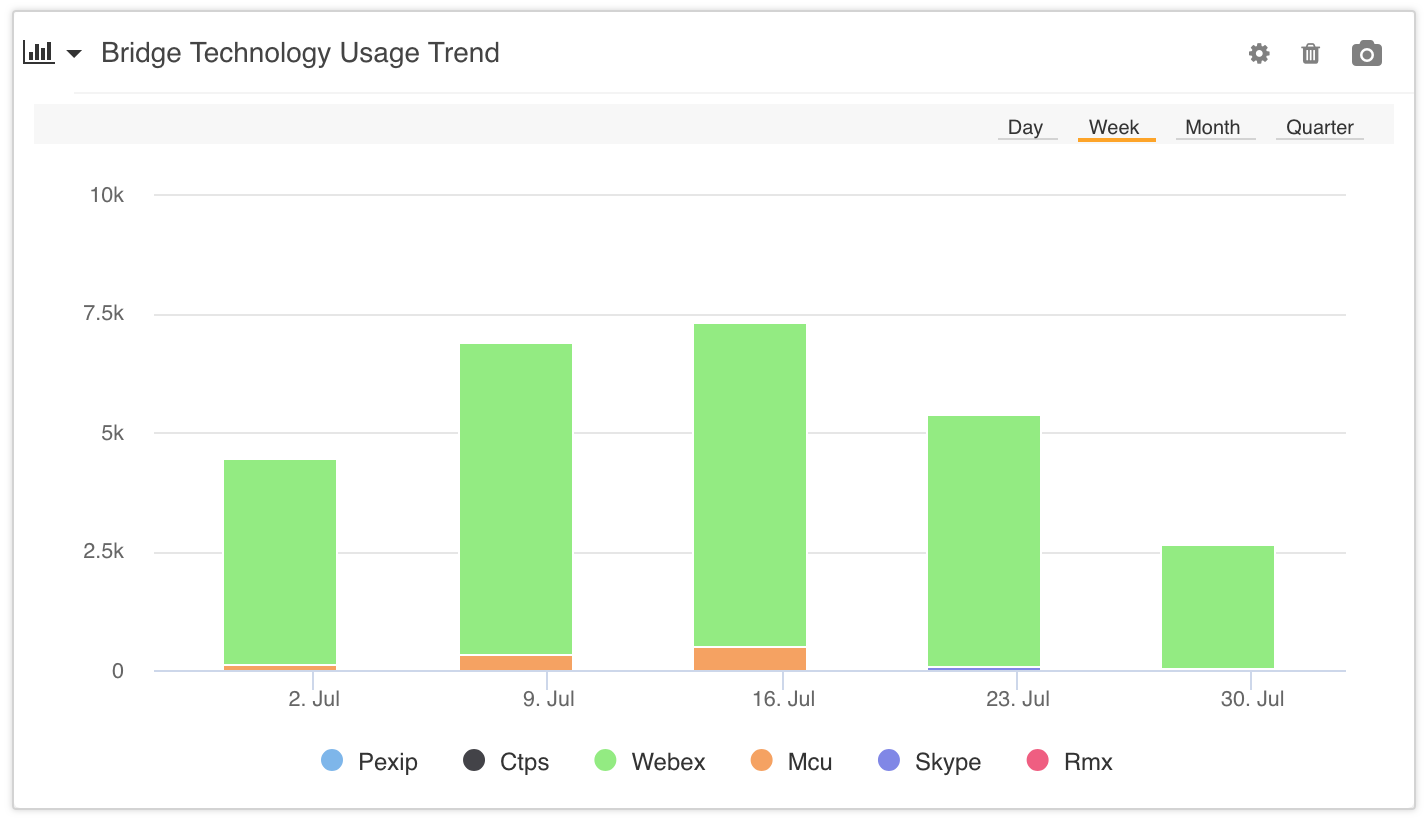
This Bar Trend graph tracks Meeting Minutes by System Type in order to give you an idea of how many real minutes of usage your users are getting out of each major system type.
The Filter Meeting Type (Bridge/P2P) Equals Bridge eliminates P2P calls and reports only on bridge calls.
Panel Settings
|
Option |
Setting |
|
Category |
Meeting |
|
Metric |
Meeting Minutes |
|
Group |
By System Type (Acronym) |
|
Display Type |
Bar Trend |
|
Filter |
Meeting Type (Bridge/P2P) Equals Bridge |
Active Endpoint Trend
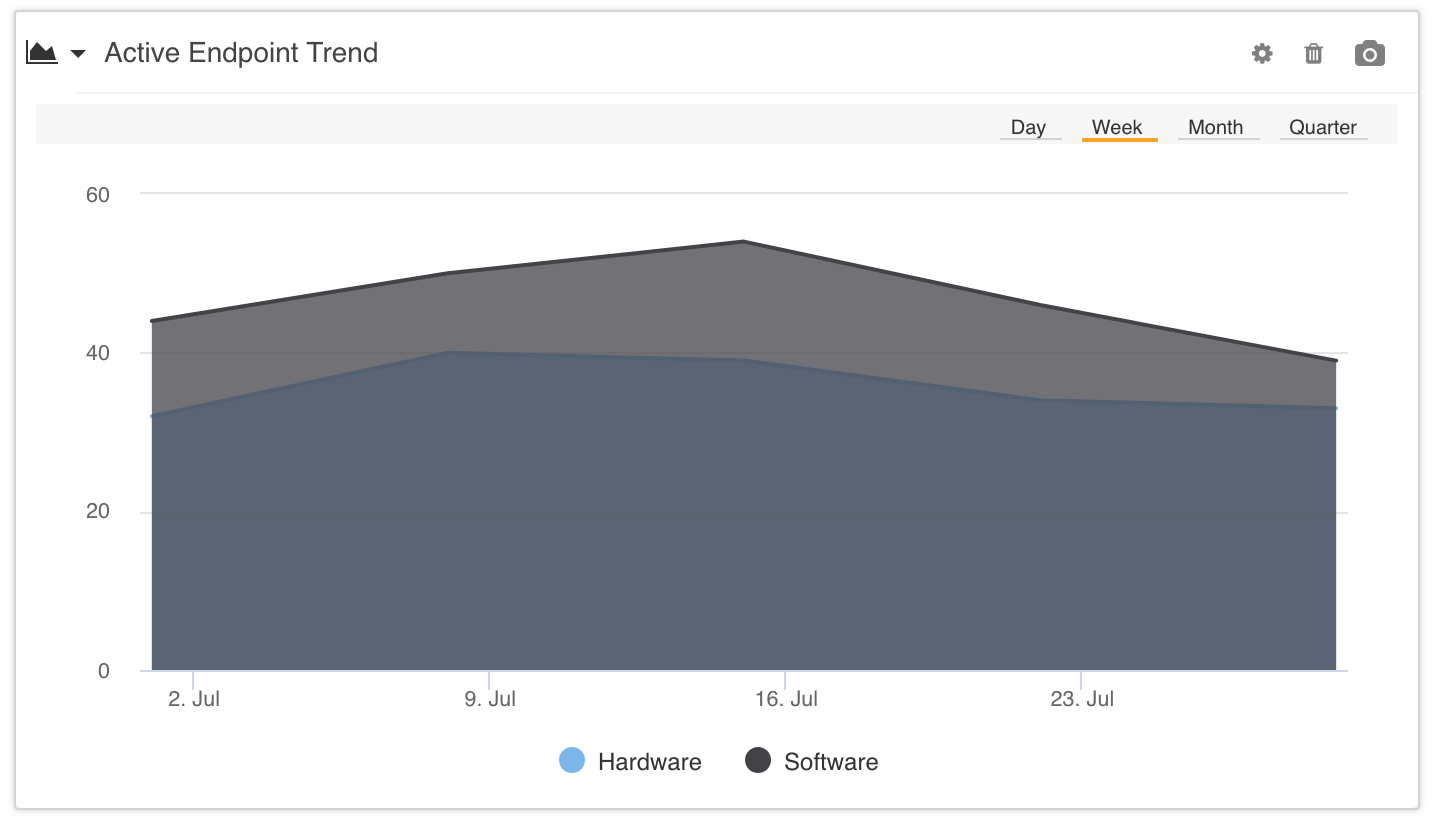
The Active Endpoint Trend is an Area Trend chart that displays active endpoints broken down by hardware and software types. We’ve added the Endpoint Type (Hardware/Software) does not equal Unknown filter to prevent unidentified endpoints from being represented.
Panel Settings
|
Option |
Setting |
|
Category |
Managed Endpoint |
|
Metric |
Active Endpoints (Count) |
|
Group |
By Endpoint Type (Hardware/Software) |
|
Display Type |
Area Trend |
|
Filter |
Endpoint Type (Hardware/Software) does not equal Unknown |
Bridge Usage Trend
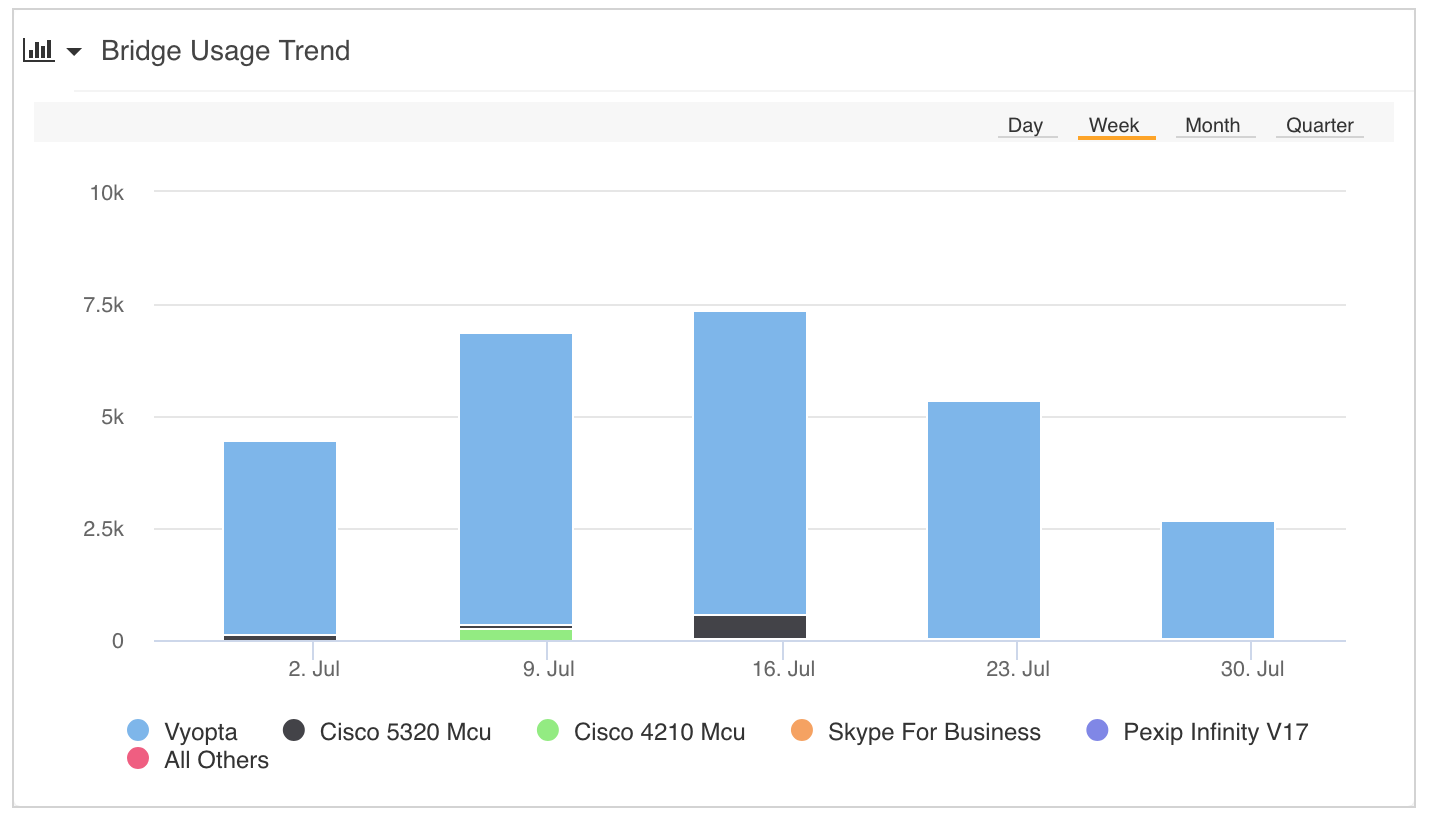
The Bridge Usage Trend panel is another Bar Trend display of meeting minutes, but this type by system name. It’s a slightly more refined query than the Bridge Technology Usage trend, as it enables you to see how specific systems are being utilized across your network.
The Filter Meeting Type (Bridge/P2P) Equals Bridge eliminates P2P calls and reports only on bridge calls.
Panel Settings
|
Option |
Setting |
|
Category |
Meeting |
|
Metric |
Meeting Minutes |
|
Group |
By System Name |
|
Display Type |
Bar Trend |
|
Filter |
Meeting Type (Bridge/P2P) Equals Bridge |
Overall Call Trend
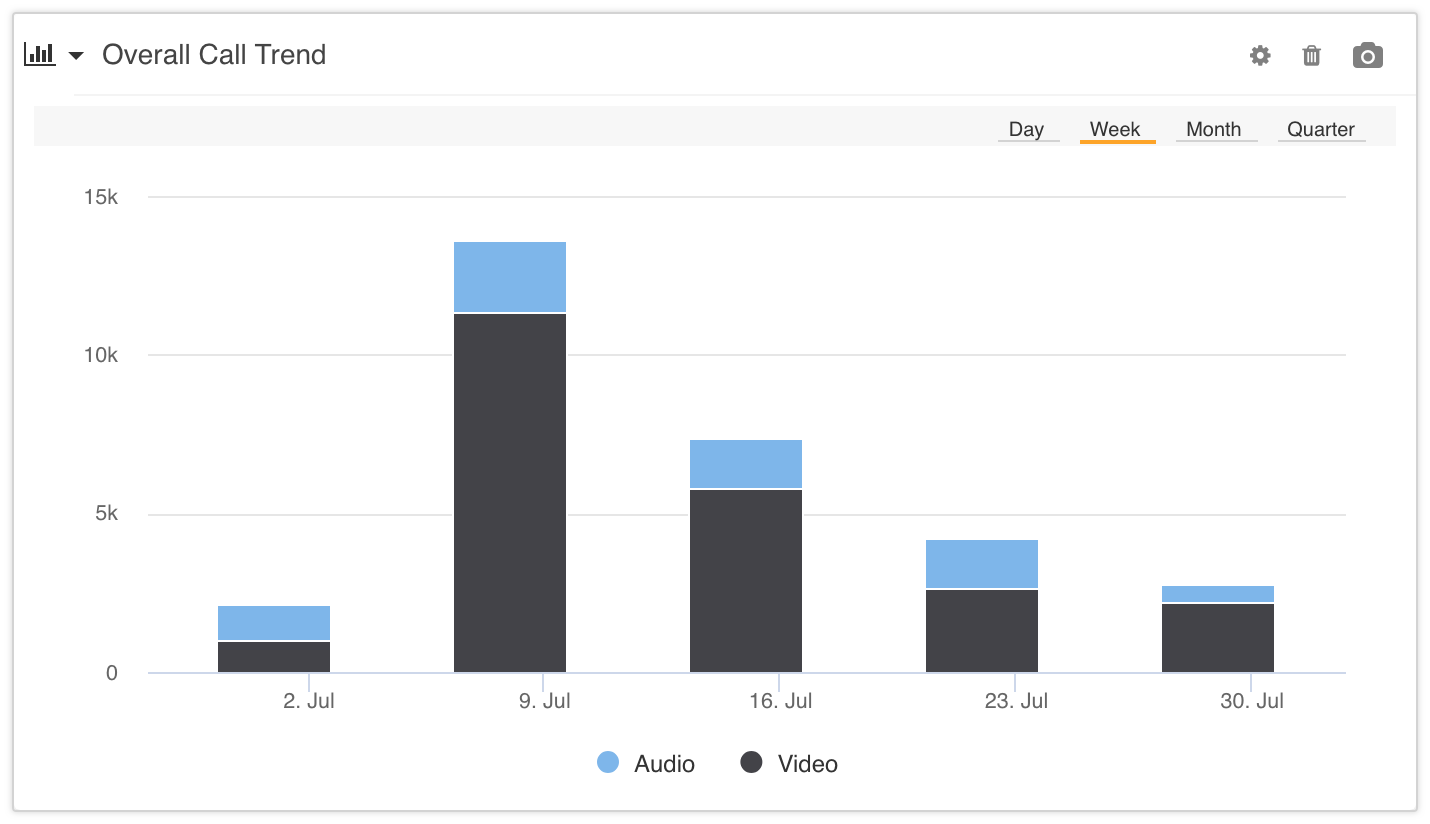
Another basic adoption metric, tracking the count of total calls, audio vs. video, is helpful to assess the level of video acceptance in an organization. The Overall Call Trend panel can be filtered to zero in on specific constituencies as necessary.
Panel Settings
|
Option |
Setting |
|
Category |
Call |
|
Metric (Value) |
Total Calls (Count) |
|
Group |
By Call Type (Audio/Video) |
|
Display Type |
Bar Trend |
|
Filter |
None |
Usage by Category
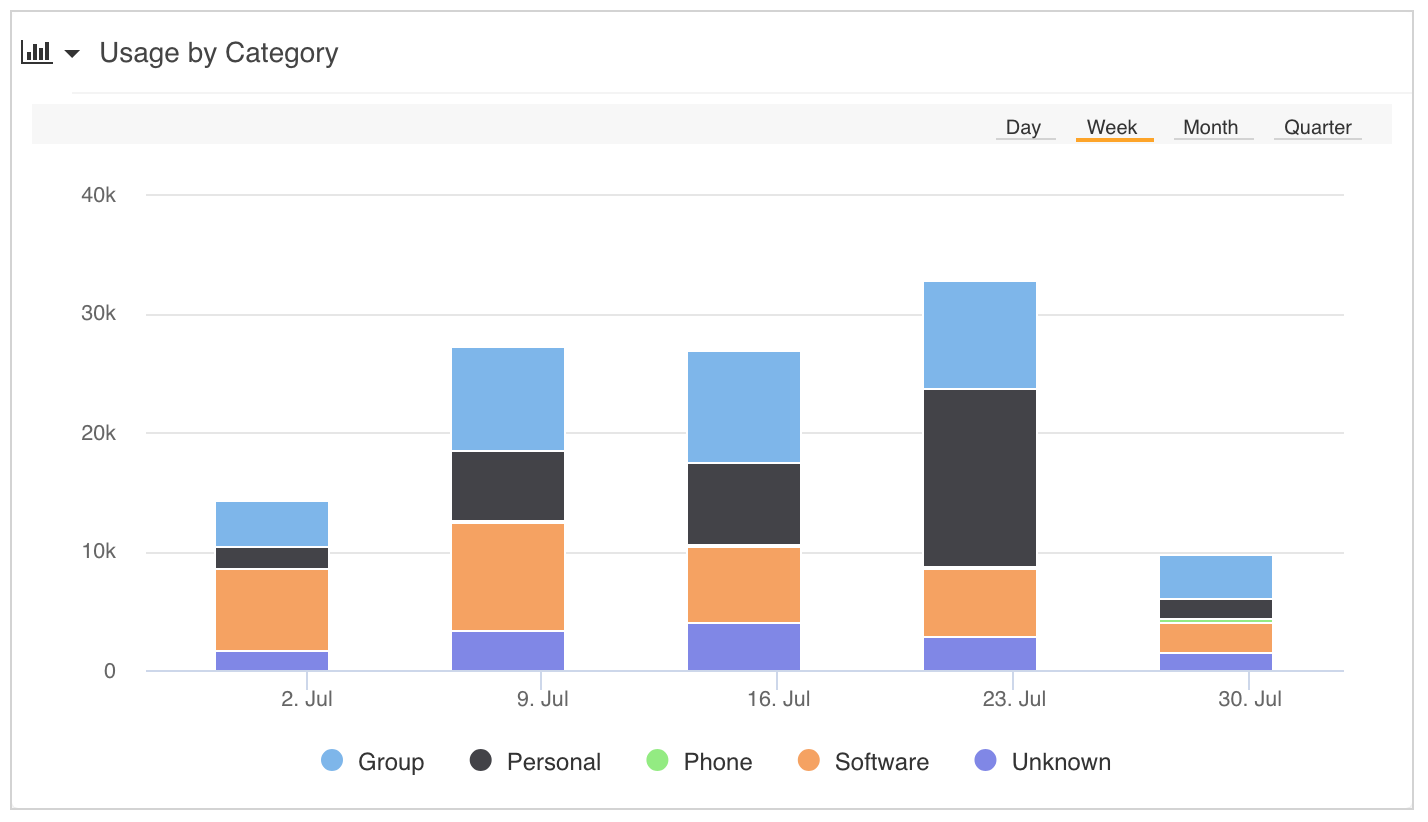
This panel gives you an overview of endpoint usage across your network over time, broken down by endpoint category. This could include elements such as group, personal, phone, software, and other endpoint types.
Panel Settings
|
Option |
Setting |
|
Category |
Managed Endpoint |
|
Metric |
Total Minutes |
|
Group |
By Endpoint Category |
|
Display Type |
Bar Trend |
Participants by Protocol Trend
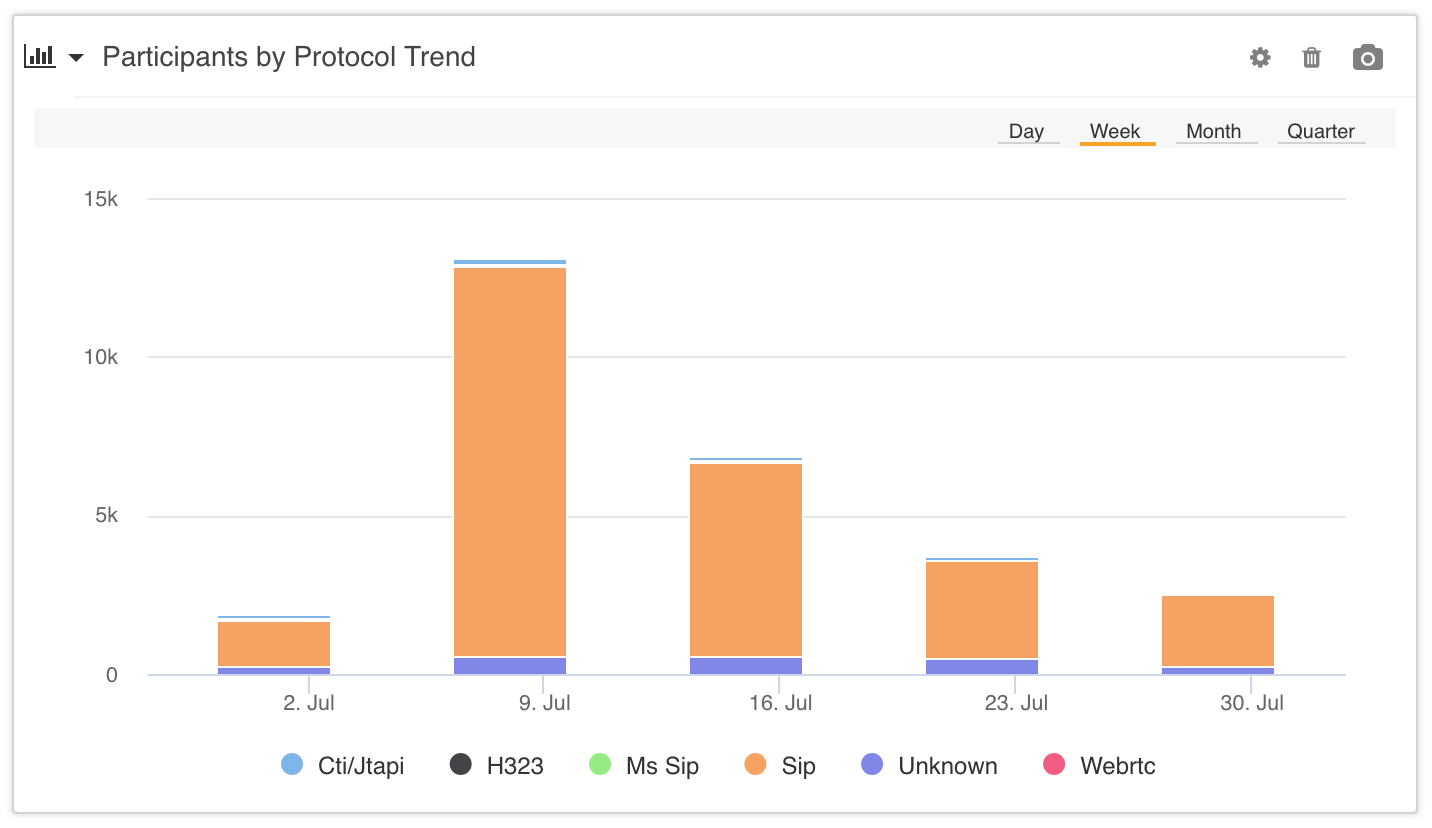
Tracking your organization’s use of different protocols is especially helpful when transitioning from one collaboration platform to another, or when you have multiple platforms available to users and are evaluating relative usage.
In this panel, we’ve created a simple Participant count organized by protocol over a period of time.
Panel Settings
|
Option |
Setting |
|
Category |
Participant |
|
Metric (Value) |
Participants (count) |
|
Group |
By Protocol |
|
Display Type |
Bar Trend |
|
Filter |
None |
Meeting Usage Trend
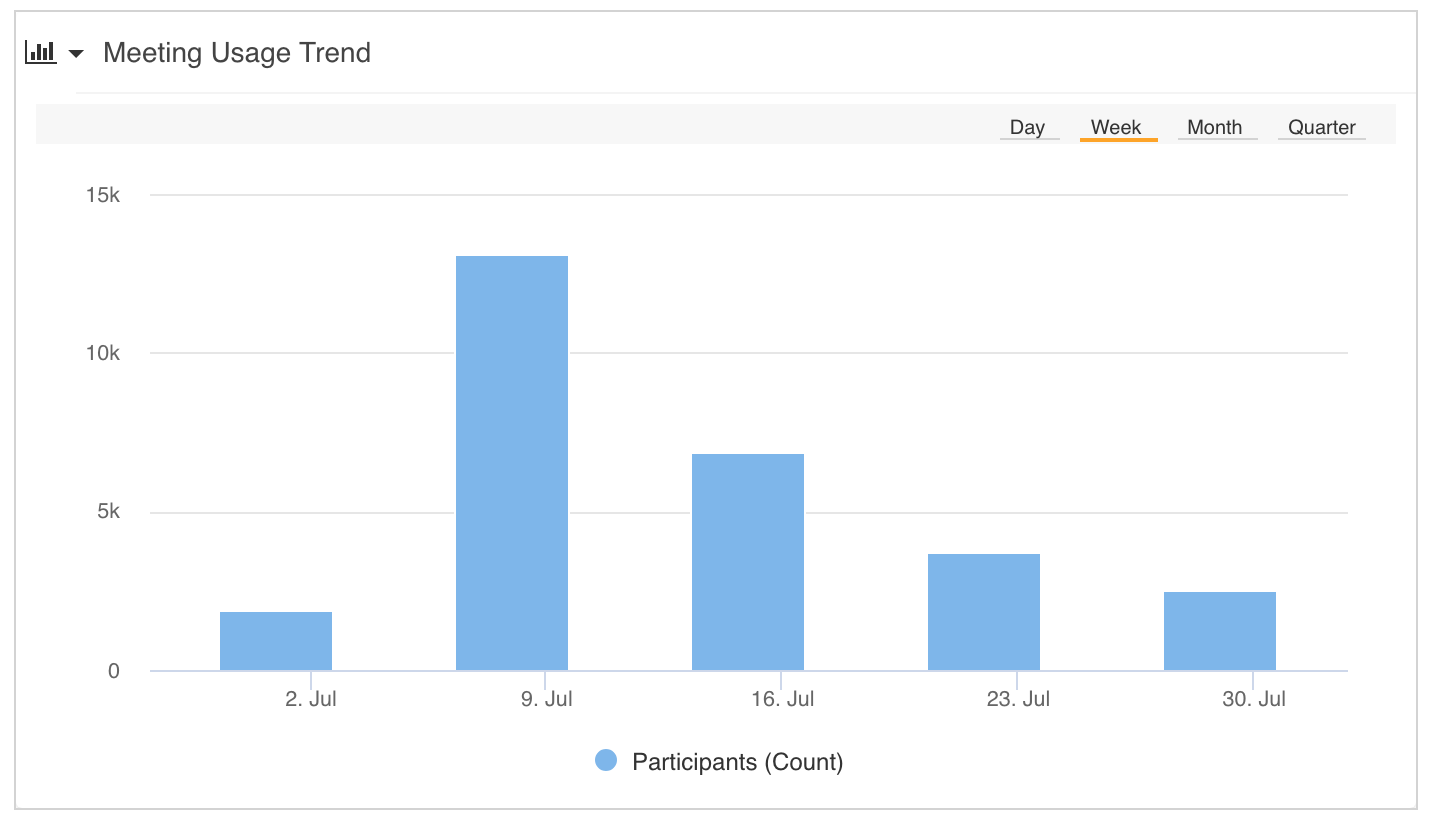
This is a simple and straightforward Bar Trend chart examining the number of meeting participants over a period of time. This is another useful way to measure the success of your adoption strategy.
Panel Settings
|
Option |
Setting |
|
Category |
Meeting |
|
Metric |
Participants (Count) |
|
Group |
No Grouping |
|
Display Type |
Bar Trend |
Top Managed Endpoint Summary – Group
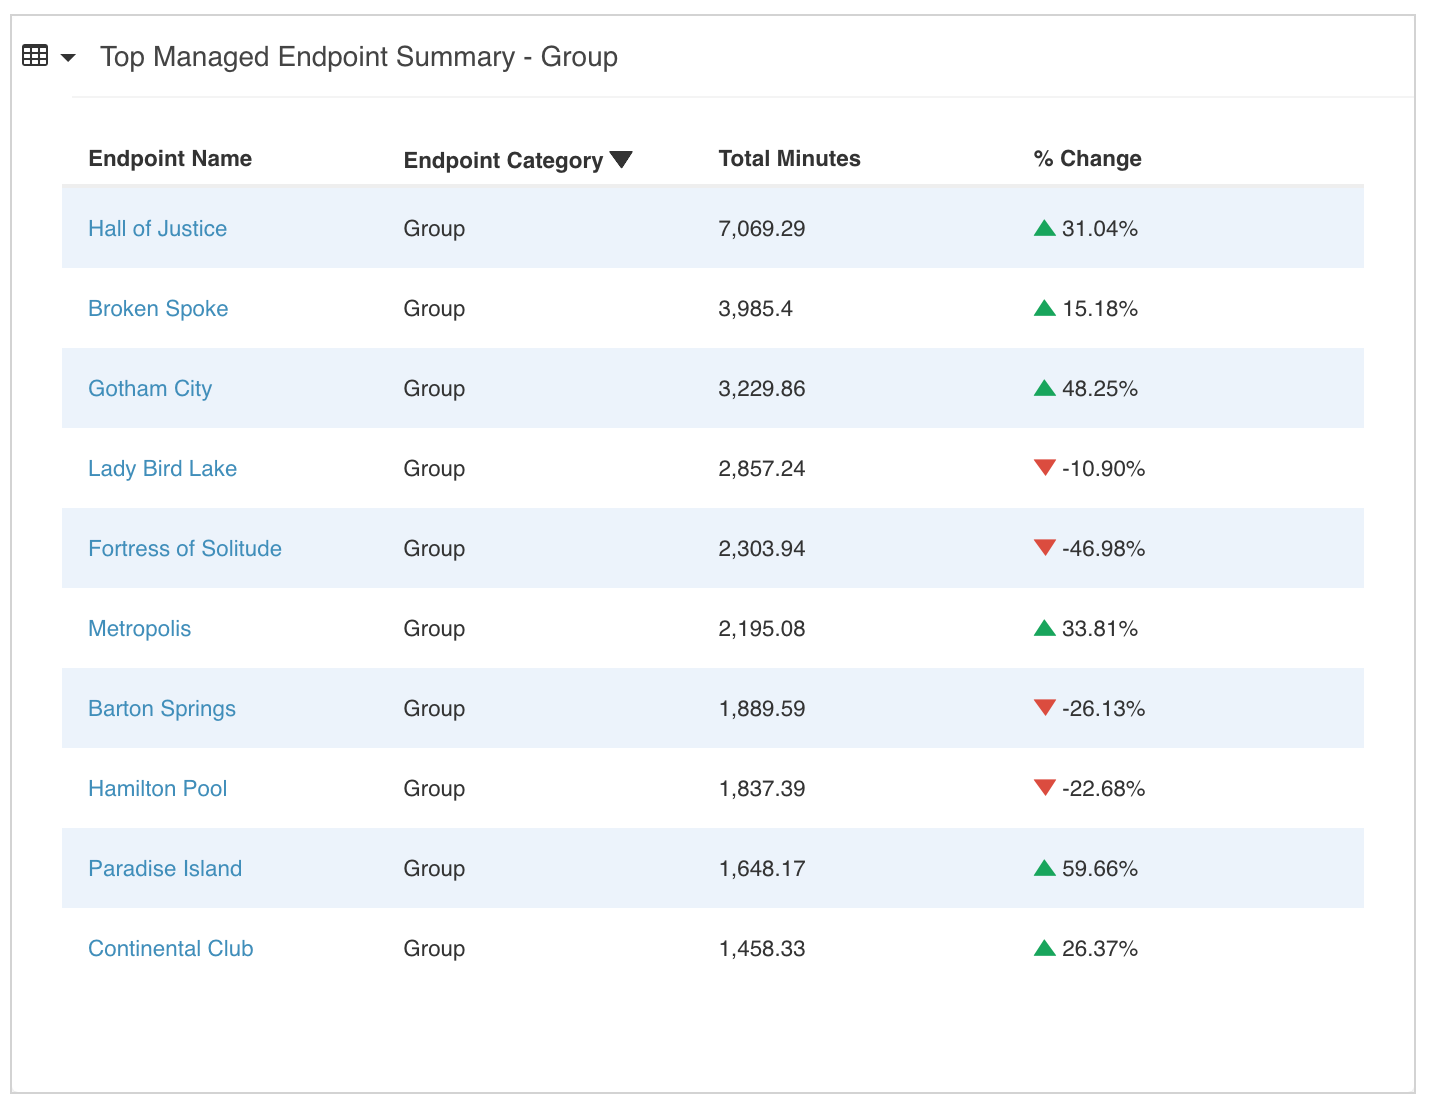
This Summary panel lists Top Managed Endpoints, featuring the endpoint name, category, total minutes utilized, and percentage change from the previous reporting period.
The Endpoint Category Equals Group filter enables the summary to display only endpoints that are in the group category.
Panel Settings
|
Option |
Setting |
|
Data Source |
Top Managed Endpoints |
|
Sort Order |
Top |
|
Filter |
Endpoint Category equals Group |
Top VMR Summary – MCU
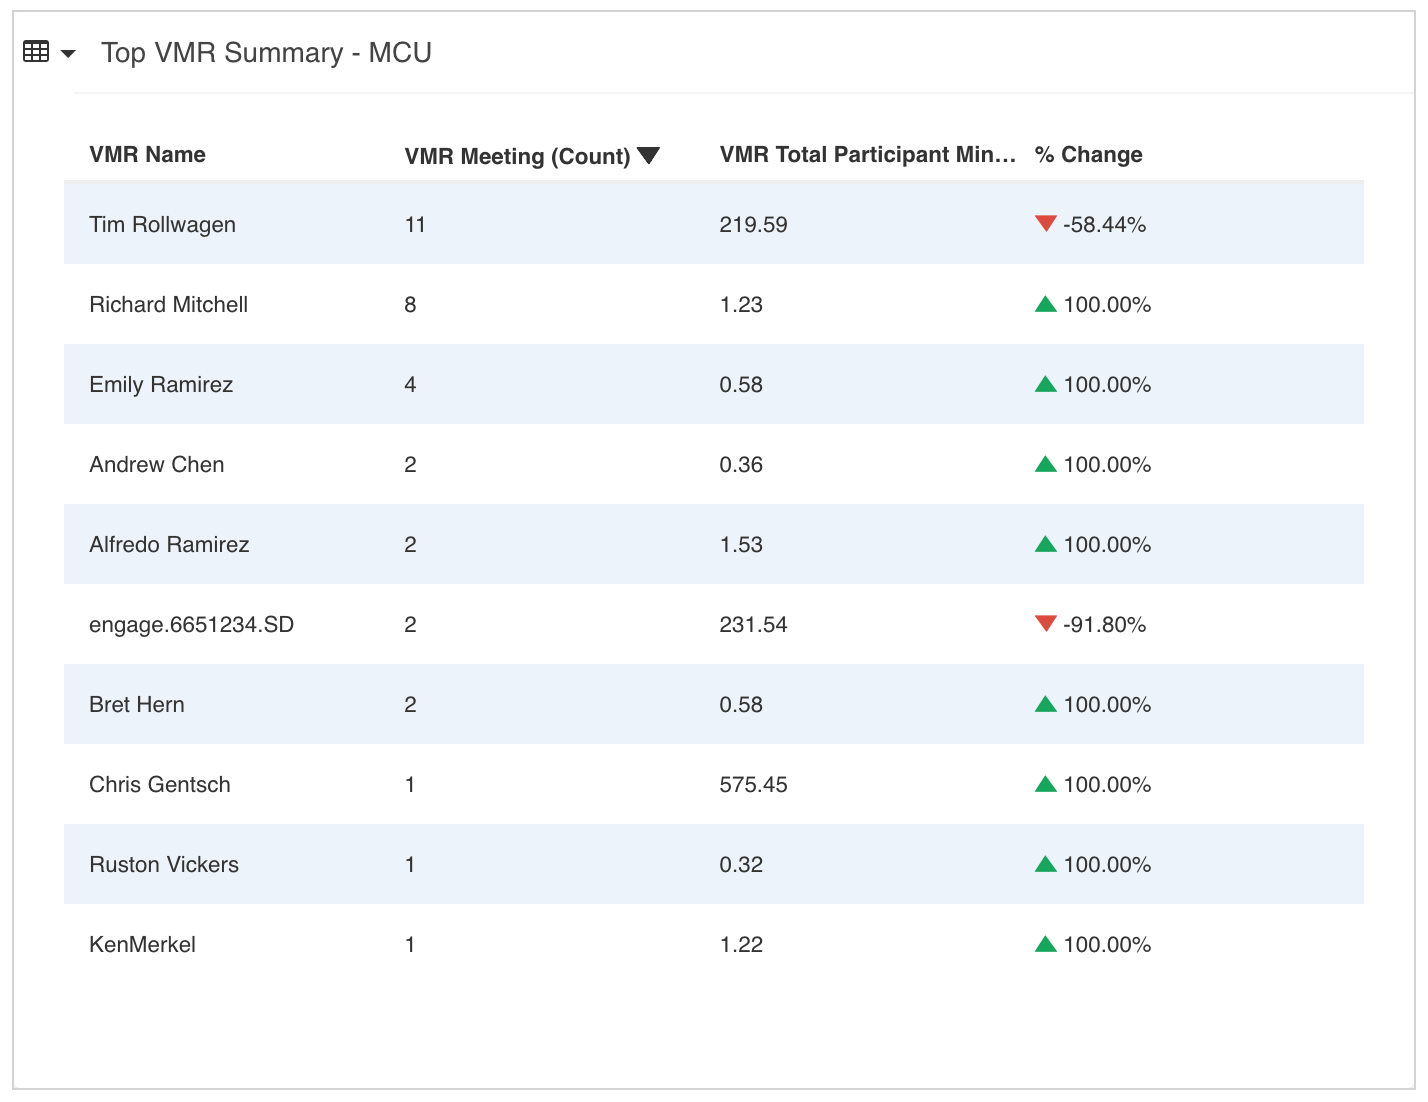
This Summary panel type lists MCU type VMRs on your network. This includes the VMR name, number of meetings over a period of time, total participant minutes, and the percentage of change over the previous reporting period. The System Type filter can be changed from MCU to any other bridge type in your UC&C environment.
Panel Settings
|
Option |
Setting |
|
Data Source |
VMRs |
|
System Type |
MCU |
|
Sort Order |
Top |