


Call Details (Advanced Analytics)
The Call Details tab presents as a table and enables users to interact with the raw meeting and usage data from an endpoint perspective.
OVERVIEW
The Call Details tab is home to an abundance of raw data collected at the endpoint, presented as individual call logs.
This isn’t the only place to see data related to individual calls, but it upon expanding data for these calls, you gain access to a host of useful information related to Call Direction, Protocol, Route, Call Type, and various endpoints data aspects.
GETTING STARTED
The Call Details area of Advanced Analytics gives you a detailed rundown of the calls that have taken place in your unified communications network.
Along the top of the page, you’ll find several important navigation and reporting tools. These tools make it easier to search, refine, and generate reports on the various meetings that have taken place in your network.
Set Reporting Period
The Date feature enables you to set a date range by which your reporting is based. Every panel displays data based on the date range defined in this area of the dashboard. You can choose from a number of pre-configured ranges including the last month, various numbers of days or months, or you can select a custom date range.
Share Data
The Share feature makes it possible to generate one-time or automated recurring report containing an image of the current page/dashboard, the underlying data in Excel and/or CSV format, and a Link to the page, all delivered via email.
The default behavior is a one-time report, but you can set a recurring Frequency schedule of Daily, Weekly, or Monthly.You can also add a Message that will accompany the report in the body of the email, as well as a custom Subject line. Finally, you can add recipient emails. The field is filled with your email address by default, but to add more than one email, simply separate them with a comma in the field.
For example: [email protected], [email protected], [email protected]
Filter Displayed Results
The Search feature is actually a filtering mechanism by which you can easily filter data so that only specific information is displayed. For example, you can set the filter to Call Minutes is greater than 1 to have vAnalytics only display call data for calls that lasted longer than one minute.
You can also select specific models to present in the data, so only endpoints that meet specific criteria are included in the page.
SUMMARY METRICS

The summary metrics for the Call Details tab are dynamic totals. They’re meant to give you an at-a-glance overview of the data being represented in the tables below.
As you select, filter, and organize the data on this page, the summary metrics will change to reflect your current view. So, if you set a Filter to focus only on calls that last 1 minute or more, then the statistics represented in Summary Metrics will also reflect that.
Here is a breakdown of the default KPI metrics included in this tab:
- Total Calls (Count): A total of calls that have taken place through endpoints on your network.
- Video Calls (Count): Total number of video calls.
- Audio Calls (Count): Total number of audio calls.
- Total Minutes: Total number of minutes spent on audio/video calls.
- Video Minutes: Total number of minutes spent on video calls.
- Audio Minutes: Total number of minutes spent on audio calls.
Edit
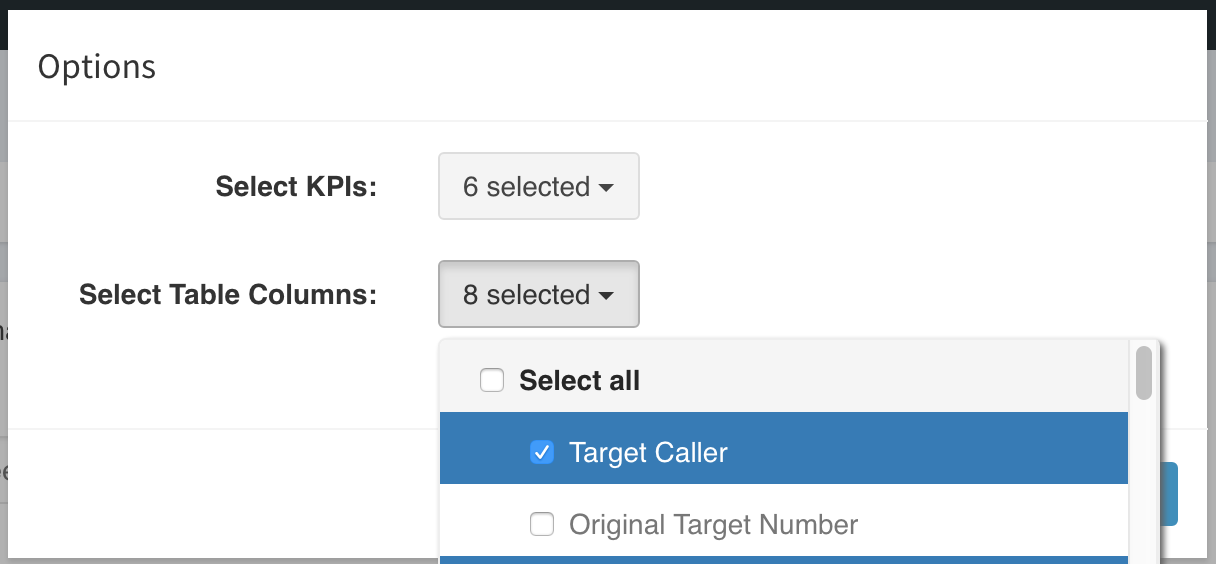
You can Edit the information that appears on the page by selecting the Edit link in the upper-right corner of the Summary Metrics.
Here, you can decide which KPIs and Table Columns to display. You can, of course, turn all of them on using the Select All option, or refine your options by selecting individual items.