


Capacity (Advanced Analytics)
The Capacity tab is home to your organization’s UC&C infrastructure utilization metrics.
OVERVIEW
The Capacity tab focuses on the utilization levels of your UC&C infrastructure, typically viewed as a percentage of licensing or port capacity of your infrastructure devices. Most capacity panels include an advanced click-through feature that enables you to view capacity details for a specific resource as it is utilized during the course of a day. To explore capacity details on any chart, mouse over a line and click a point on the graph.
DEFAULT CAPACITY PANELS
The default capacity panels are built using the Trend panel type to view capacity data over time, based on the types of infrastructure present in your environment. Vyopta will automatically add individual trend capacity panels based off the infrastructure type present in your organization upon creation of your account and first time login.
All capacity panels have editable parameters enabling the selection of specific devices in case you want to segment capacity as per your organization’s specific needs. It is usually more convenient, however, to use the built-in enable/disable capability in the chart legend to tailor the display dynamically, allowing you to focus on an individual system or systems as needed.
Current supported capacity panels include: Cisco CMS, CTPS, CUCM Trunk, Expressway, MCU, VCS, Pexip, Polycom RMX, Vidyo, Webex and Zoom.
EXAMPLE CAPACITY PANELS
CMS Peak Capacity
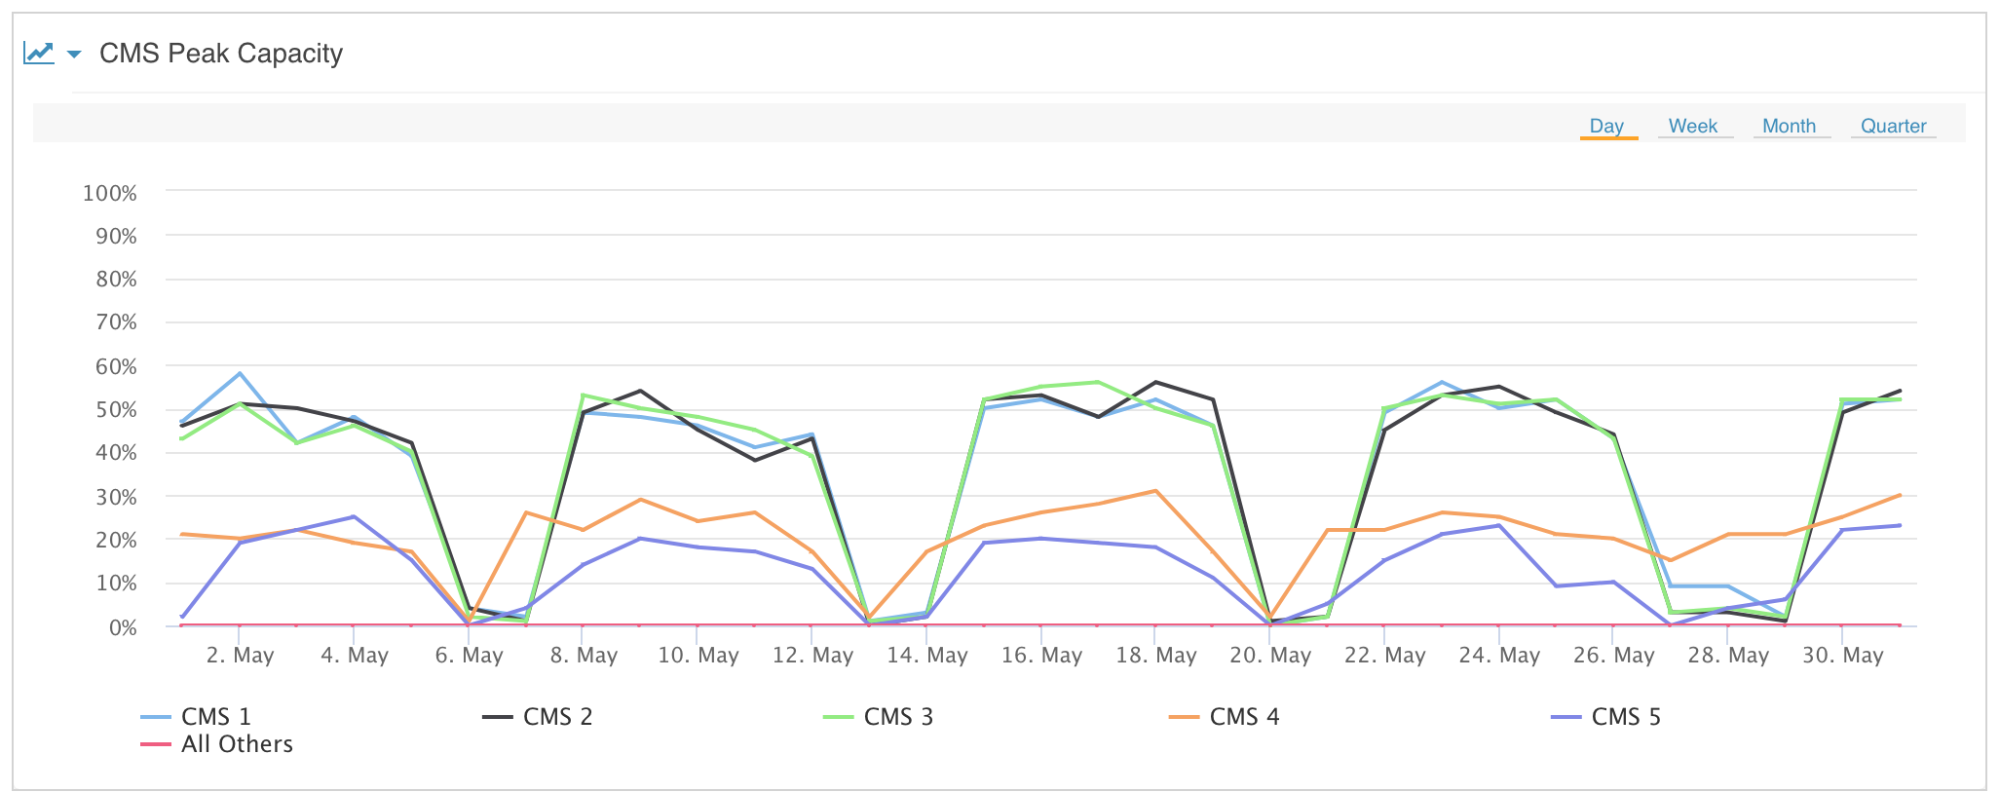
In this example, CMS system capacity is tracked as a percentage of licensed capacity utilized at the peak of the interval specified (day, week, month, quarter) over time. Data is grouped by CMS instance name, and a system filter is applied to focus the resulting data for the CMS (Acano) system type.
Panel Settings
|
Option |
Setting |
|
Category |
Capacity |
|
Metric (Value) |
System Capacity Percentage |
|
Group |
By System Name |
|
Display Type |
Line Trend |
|
Filter |
System Type (Acronym) equals Acano -or- Select: Systems→ Bridge→ Acano |
Expressway Cluster Traversal Peak Capacity
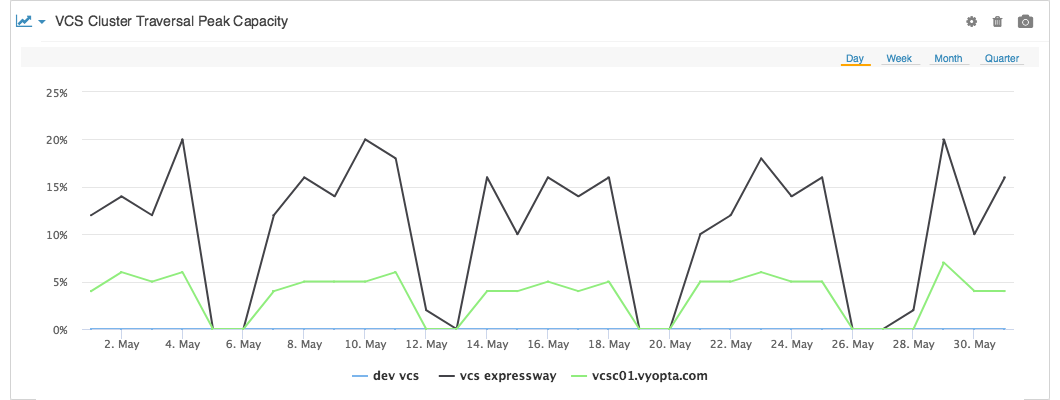
In this example, VCS cluster capacity is tracked as a percentage of licensed capacity utilized at the peak of the interval specified (day, week, month, quarter) over time. Data is grouped by cluster name, and a filter is applied to focus on the result of this panel’s data for Traversal calls. (Non-traversal calls can be captured in the same manner by changing the filter to “Non Traversal.”)
Panel Settings
|
Option |
Setting |
|
Category |
Capacity |
|
Metric (Value) |
VCS Cluster System Capacity Percentage |
|
Group |
By Cluster Name |
|
Display Type |
Line Trend |
|
Filter |
Measurement (Unit of) Equals Traversal |