


Endpoints (Advanced Analytics)
The Endpoints tab is your resource for data related to the endpoints in your UC&C network.
OVERVIEW
The Endpoints area of vAnalytics offers a full breakdown of Managed Endpoints, Unmanaged Endpoints, Inventory, and Call Details.
The Endpoints Area can help you generate insights on both the endpoints that you manage and the endpoints outside of your network that your managed endpoints are calling. You can gain insights on individual and sets of endpoints like which endpoints are being utilized most/least, which ones are subject to vulnerabilities, and details on exactly how these endpoints are performing on calls.
GETTING STARTED
The Endpoints area of vAnalytics has four sub-tabs within it:
- Managed Endpoints: A listing of activity for managed endpoints in your network.
- Unmanaged Endpoints: A breakdown activity for all endpoints that Vyopta is able to see call activity, but Vyopta is not able to mark that Endpoint as Managed.
- Inventory: Device attribute data on managed endpoints (hardware and software).
- Call Details: A detailed list of call-leg level data for managed endpoints.
Along the top of the page, you’ll find several important navigation and reporting tools. These tools make it easier to search, refine, and generate reports on the various meetings that have taken place in your network.
Set Reporting Period
The Date feature enables you to set a date range by which your reporting is based. All of the data on this page is displayed based on the date range defined in this area of the page. You can choose from a number of pre-configured ranges including the last month, various numbers of days or months, or you can select a custom date range.
Share Data
The Share feature makes it possible to generate one-time or automated recurring report containing an image of the current page/dashboard, the underlying data in Excel and/or CSV format, and a Link to the page, all delivered via email.
The default behavior is a one-time report, but you can set a recurring Frequency schedule of Daily, Weekly, or Monthly.You can also add a Message that will accompany the report in the body of the email, as well as a custom Subject line. Finally, you can add recipient emails. The field is filled with your email address by default, but to add more than one email, simply separate them with a comma in the field.
For example: [email protected], [email protected], [email protected]
Filter Displayed Results
The Search feature is actually a filtering mechanism by which you can easily filter data so that only specific information is displayed. For example, you can set the filter to Utilization Rate is greater than 25% to have vAnalytics only display endpoint data from endpoints with an above 25% utilization rate.
You can also select specific models to present in the data, so only endpoints that meet specific criteria are included in the page.
SUMMARY METRICS
The summary metrics for the Meetings tab are dynamic totals. They’re meant to give you an at-a-glance overview of the data being represented in the tables below.
As you select, filter, and organize the data on this page, the summary metrics will change to reflect your current view. So, if you set a Filter to focus only on endpoints with a 25% utilization rate or more, then the statistics represented in Summary Metrics will also reflect that.
Each tab has its own set of default summary metrics (represented in KPIs). The one exception is the Inventory tab, which is a breakdown of different hardware and software endpoints n your network.
Edit
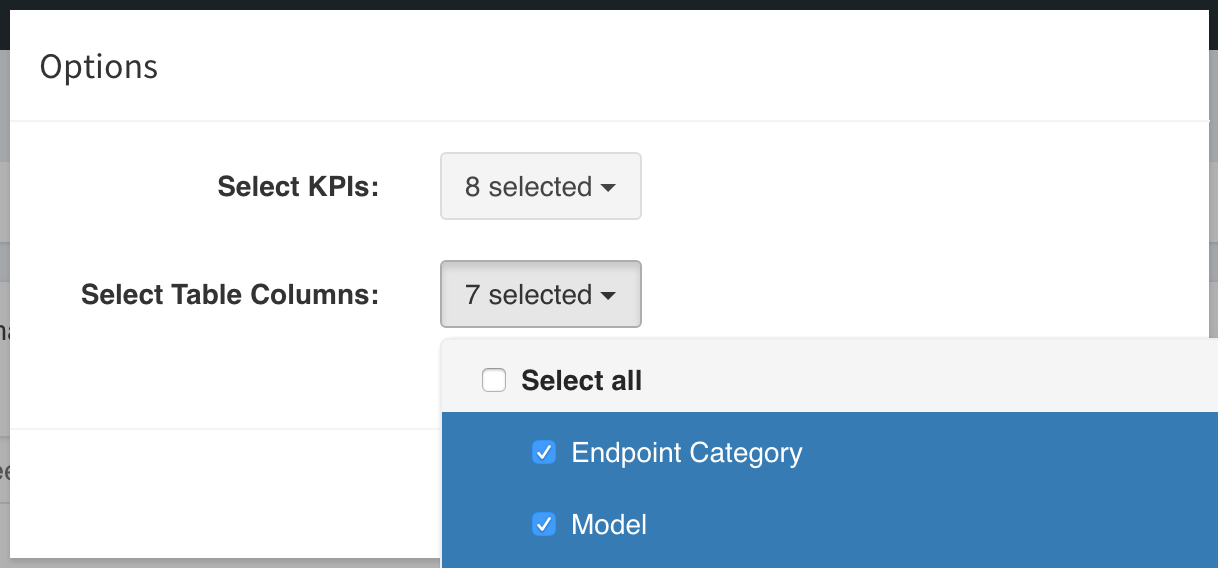
You can Edit the information that appears on the page by selecting the Edit link in the upper-right corner of the Summary Metrics.
Here, you can decide which KPIs and Table Columns to display. You can, of course, turn all of them on using the Select All option, or refine your options by selecting individual items.
Managed Endpoints
Managed Endpoints are essentially endpoints that are actively managed by one of Vyopta’s supported platforms. This includes management tools by Cisco, Tandberg, and Polycom, including:
- Cisco TelePresence Management Suite (TMS)
- Cisco TelePresence Management Suite Provisioning Extension (TMSPE)
- Cisco Unified Communications Manager (CUCM)
- Polycom RealPresence Resource Manager (RPRM)
- VidyoPortal
Utilization Rate
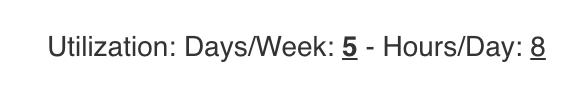
A feature unique to the Managed Endpoints tab is the Utilization Rate. This setting allows you to set the amount of data and hours-per-day an endpoint is expected to be utilized. Based on this setting, the Utilization Rate for each item is determined.
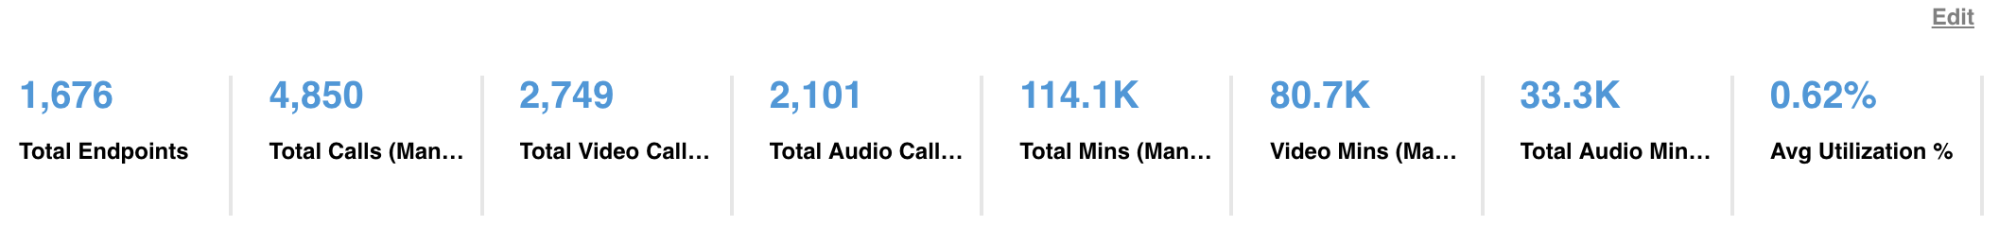
Here is a breakdown of the default KPI Summary Metrics items under the Managed Endpoints tab.
- Total Endpoints: Total number of devices in selected data.
- Total Calls (Managed Endpoint): Total number of calls made by known (managed) devices.
- Total Video Calls: Number of video calls made by selected devices.
- Total Audio Calls: Audio only calls made by selected devices.
- Total Mins (Managed Endpoint): Total audio and video minutes.
- Total Video Mins: Total video minutes.
- Total Audio Mins: Total audio only minutes.
- Avg Utilization %: Utilization percentage during a user-defined duration for each workday.
Unmanaged Endpoints
The Unmanaged Endpoints (also known as aliases) tab is home to data gathered concerning endpoints that aren’t covered under the Managed Endpoints.
This includes endpoints or aliases which are registered but not managed such as endpoints registered to call control or any endpoint that was previously managed that made calls. This may also include any unmanaged endpoint source.
Items listed here are tracked by their endpoint type, total calls and minutes of call time, number of issues, and more. Expanding an endpoint in this list will reveal call data including the remote address, start and end times, call direction, call type, etc.
The default Summary Metrics included in the Unmanaged Endpoints tab include:
- Total Aliases: Total number of aliases in selected data.
- Total Calls (Unmanaged Endpoint): Total number of calls made by unmanaged endpoints.
- Total Video Calls (Unmanaged Endpoints): Number of video calls made by selected devices.
- Total Audio Calls (Unmanaged Endpoints): Audio only calls made by selected devices.
- Total Mins (Unmanaged Endpoints): Total audio and video minutes.
- Video Minutes: Total video minutes.
- Audio Minutes: Total audio only minutes.
Inventory
The Inventory tab is a list of your hardware and software endpoints. This could include Skype, Jabber, and your physical endpoints. That allows you to accomplish many of the same tasks usually completed from the Settings tab, but from here you can generate shared reports as well.
The Inventory tab tracks metrics such as the system name, subcategory, IP address, serial number, manufacturer, model, and any known vulnerabilities that need to be addressed.
Call Details
The Call Details tab is home to an abundance of raw data collected at the endpoint, presented as individual call logs.
This isn’t the only place to see data related to individual calls, but it upon expanding data for these calls, you gain access to a host of useful information related to Call Direction, Protocol, Route, Call Type, and various endpoints data aspects.
The Call Details tab includes another set of default KPIs. They are as follows:
- Total Calls (Count): A total of calls that have taken place through endpoints on your network.
- Video Calls (Count): Total number of video calls.
- Audio Calls (Count): Total number of audio calls.
- Total Minutes: Total number of minutes spent on audio/video calls.
- Video Minutes: Total number of minutes spent on video calls.
- Audio Minutes: Total number of minutes spent on audio calls.