


Infrastructure (Advanced Analytics)
Your communications infrastructure is listed in detail in the powerful Advanced Analytics Infrastructure tab.
OVERVIEW
The Infrastructure Tab in Advanced Analytics serves as a central point to gain intelligence on the core infrastructure that supports your UC&C environment.
The table view which is featured prominently in this tab sheds light on the critical infrastructure assets, their availability, license information, total number of calls placed through them, and more.
This is a useful resource for determining which assets in your UC&C environment are being utilized the most, whether or not they’re monitored through Vyopta’s software, and how available these assets are to your organization.
Perhaps more critically, this resource enables the unified communications architect and support team to instantly determine which assets are failing to deliver connected calls, and which ones are being underutilized on the network.
GETTING STARTED
The Infrastructure tab of Advanced Analytics is a very straightforward and simple way to access information you need about your UC&C infrastructure. We’ll go over the most important components of this page, and how they can improve your experience with vAnalytics.
Set Reporting Period
The Date feature enables you to set a date range by which your reporting is based. Every panel displays data based on the date range defined in this area of the dashboard. You can choose from a number of pre-configured ranges including the last month, various numbers of days or months, or you can select a custom date range.
Share Data
The Share feature makes it possible to generate one-time or automated recurring report containing an image of the current page/dashboard, the underlying data in Excel and/or CSV format, and a Link to the page, all delivered via email.
The default behavior is a one-time report, but you can set a recurring Frequency schedule of Daily, Weekly, or Monthly.You can also add a Message that will accompany the report in the body of the email, as well as a custom Subject line. Finally, you can add recipient emails. The field is filled with your email address by default, but to add more than one email, simply separate them with a comma in the field.
For example: [email protected], [email protected], [email protected]
Filter Displayed Results
The Filter feature is an advanced mechanism by which you can easily filter data so that only specific information is displayed. For example, you can set the filter to System Type (Acronym) equals MCU to have only the infrastructure assets that are desired displaying in the results.
SUMMARY METRICS
The summary metrics for the Infrastructure tab are dynamic totals. They’re meant to give you an at-a-glance overview of the data being represented in the tables below.
As you select, filter, and organize the data on this page, the summary metrics will change to reflect your current view. So, if you set a Filter to focus only on calls that have a participant count of two or less, then the statistics represented in Summary Metrics will also reflect that.
Each tab has its own set of default summary metrics (represented in KPIs). Here is a breakdown of the default items under the Infrastructure tab.

- Total Systems: The count of infrastructure assets included in the Infrastructure Tab (with no filters).
- Total Calls: The sum of calls (audio and video) across all systems in the Infrastructure tab during the reporting period.
- Total Video Calls (Systems): The sum of video calls across all systems in the Infrastructure tab during the reporting period.
- Total Audio Calls (Systems): The sum of audio calls across all systems in the Infrastructure tab during the reporting period.
- Total Mins (Systems): The sum of call minutes (audio and video) across all systems in the Infrastructure tab during the reporting period.
- Total Video Mins (Systems): The sum of video call minutes across all systems in the Infrastructure tab during the reporting period.
- Total Audio Mins (Systems): The sum of audio call minutes across all systems in the Infrastructure tab during the reporting period.
Edit
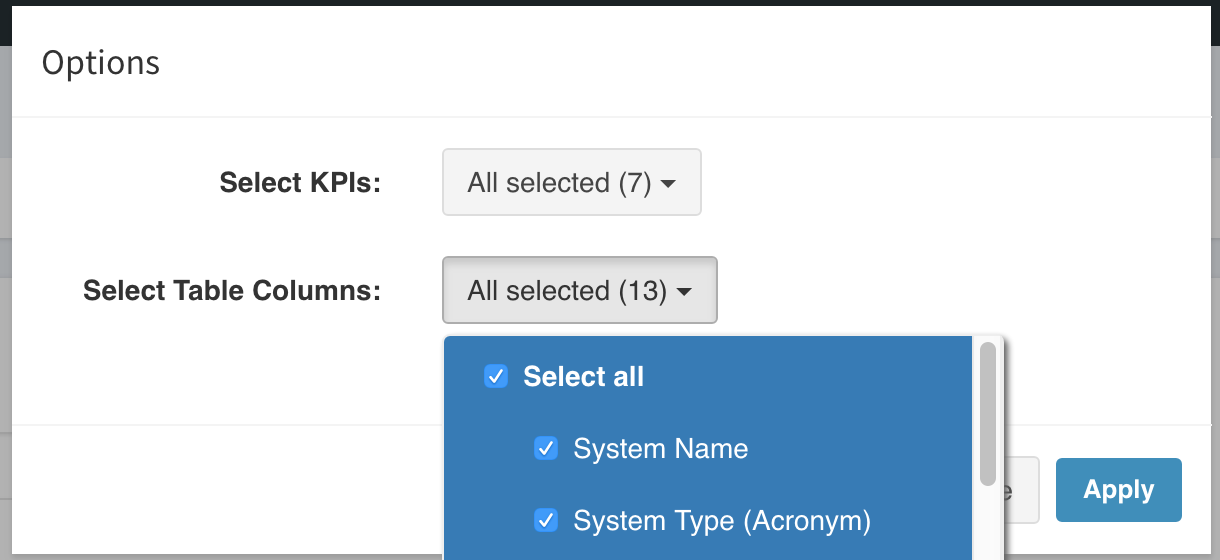
You can Edit the information that appears on the page by selecting the Edit link in the upper-right corner of the Summary Metrics.
Here, you can decide which KPIs and Table Columns to display. You can, of course, turn all of them on using the Select All option, or refine your options by selecting individual items.