


Rooms (Advanced Analytics)
The Rooms tab is a dynamic overview of collaboration spaces in your workplace.
OVERVIEW
The Rooms tab serves as a collection of data on the collaboration spaces in your workplace Because this data set is from a rooms perspective you are able to see utilization of the room from both a call and non-call activity perspective. When Vyopta’s endpoint monitor is properly configured for the endpoints that are mapped to these rooms, you’re able to metrics like non-call people count and presentation activity in addition to the standard call activity analytics you expect from the core of Vyopta’s Advanced Analytics. When you layer scheduling data on top of these activities, the Rooms tab becomes a resource for IT and Facilities teams alike.
GETTING STARTED
Along the top of the page, you’ll find several important navigation and reporting tools. These tools make it easier to search, refine, and generate reports on the various meetings that have taken place in your network.
Set Reporting Period
The Date feature enables you to set a date range by which your reporting is based. Every panel displays data based on the date range defined in this area of the dashboard. You can choose from a number of pre-configured ranges including the last month, various numbers of days or months, or you can select a custom date range.
Share Data
The Share feature makes it possible to generate one-time or automated recurring report containing an image of the current page/dashboard, the underlying data in Excel and/or CSV format, and a Link to the page, all delivered via email.
The default behavior is a one-time report, but you can set a recurring Frequency schedule of Daily, Weekly, or Monthly.You can also add a Message that will accompany the report in the body of the email, as well as a custom Subject line. Finally, you can add recipient emails. The field is filled with your email address by default, but to add more than one email, simply separate them with a comma in the field.
For example: [email protected], [email protected], [email protected]
Filter Displayed Results
The Filter feature is actually a filtering mechanism by which you can easily filter data so that only specific information is displayed. For example, you can set the filter to Attended Meeting Count equals 3, so that only rooms with three attended meetings are presented.
SUMMARY METRICS
The summary metrics for the Rooms tab are dynamic totals. They’re meant to give you an at-a-glance overview of the data being represented in the tables below.
As you select, filter, and organize the data on this page, the summary metrics will change to reflect your current view. So, if you set a Filter to focus only on calls that have a participant count of two or less, then the statistics represented in Summary Metrics will also reflect that.
Each tab has its own set of default summary metrics (represented in KPIs). Here is a breakdown of the default items under the Rooms tab.

- Rooms: Total number of teleconference rooms.
- Scheduled Meeting Minutes: Total number of minutes for meetings scheduled.
- Average Schedule %: Average amount of utilization time scheduled.
- Average Call Utilization %: Average amount of utilization time on a call.
- Scheduled Meeting Count: Total number of scheduled meetings.
- Attended Meeting Count: Total number of attended meetings.
- Attended Meeting Minute: Total number of minutes in attended meetings.
- Average Attended Meeting %: Average percentage of attended meetings.
- Average Missed %: Average % of missed calls across all rooms.
- Missed Meeting Count: Total number of missed meetings.
- Unused Meeting Minute: Total meeting minutes unused.
Edit
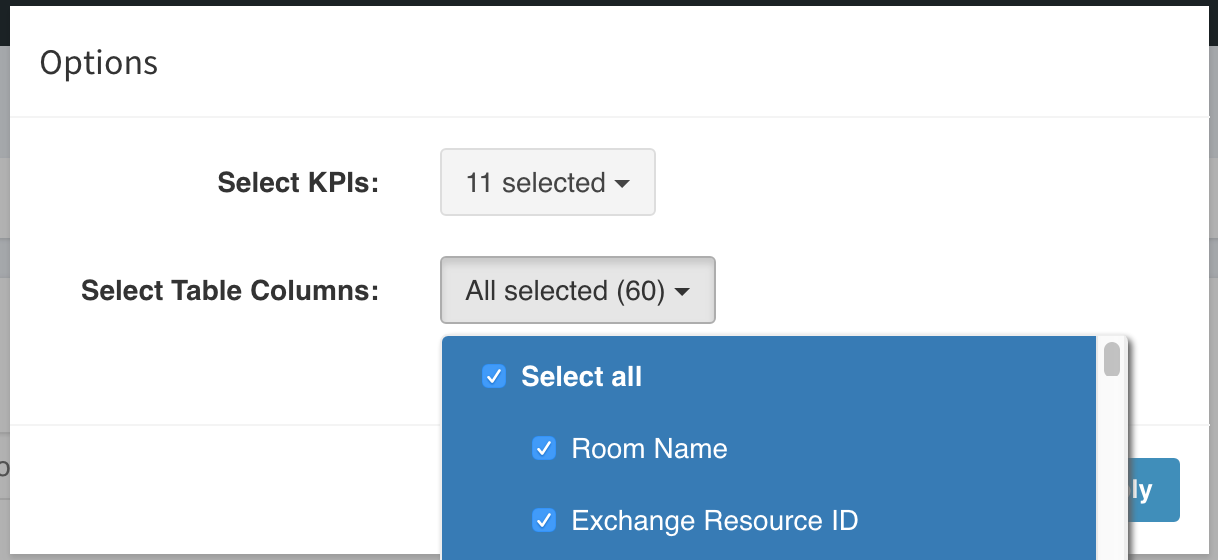
You can Edit the information that appears on the page by selecting the Edit link in the upper-right corner of the Summary Metrics.
Here, you can decide which KPIs and Table Columns to display. You can, of course, turn all of them on using the Select All option, or refine your options by selecting individual items.