Collaboration is Changing
If you are reading this, it is likely you have seen firsthand the rapid growth of unified communication and collaboration (UC&C) across industries and at organizations of all sizes. At Vyopta, we have made it our mission to help transform how companies communicate, so we have witnessed some amazing growth at companies across the spectrum. However, whenever we work with a new customer, we still almost always run into a problem right off the bat: nobody really tracks adoption of UC&C and they don’t know how to start. We usually propose many ways to track adoption, but most customers also want to track the evolution of collaboration from traditional phone and conferencing to more modern communication that consists of on-demand video, chat, and collaboration that moves content across multiple modalities instead of being limited by the meeting format or modality. To shorten this post, I will just call this new collaboration usage “good” adoption.
There are many ways to do this, such as tracking software users, remote calls outside the company WAN, or track usage of newer technologies. We find that one way to measure “good new collaboration” is with video usage.
What is adoption and what kinds of information can it show?
In this previous blog, we covered what we meant by adoption and different ways to measure it. In general, adoption covers both usage and activity. A brief summary of the explanation is: Adoption is the number of users who actively use something (active users), and Usage is how much of it they use (usually measured in calls, meetings, or minutes).
Why video usage serves as a leading indicator
Now that we’ve determined some of the types of data we can find out by referencing adoption, let’s consider the idea of why video usage is an indicator of “good” adoption.
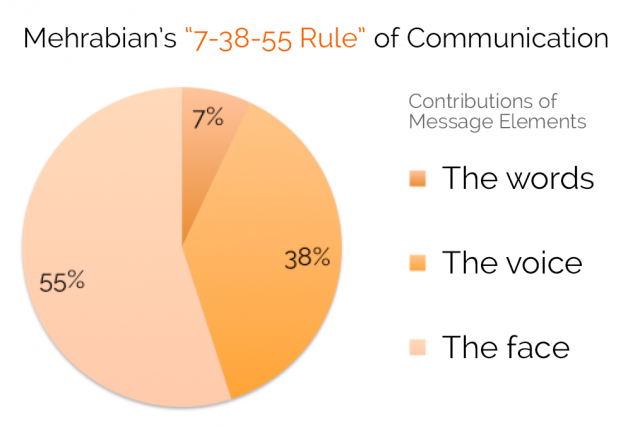
- Video indicates more valuable collaboration because it means they have video, audio, and probably presentation sharing. Video also includes nonverbal communication, which is more than half of all communication value according to many different studies.
- Video collaboration indicates a more advanced application, even in software. Video-enabled rooms are more expensive than audio only, and software that includes video is also either more expensive or newer. Both of which indicate growth of adoption in the right direction.
- Once you go video, you never go back. Awkward wording, but you get what I mean. It’s important to know when people are breaking their comfort barrier by using video the first few times because people who start using video are likely to use richer communication methods more often. This is why New Users is another alternate metric that Vyopta can help you track.
That makes sense, but what is a good level of video usage?
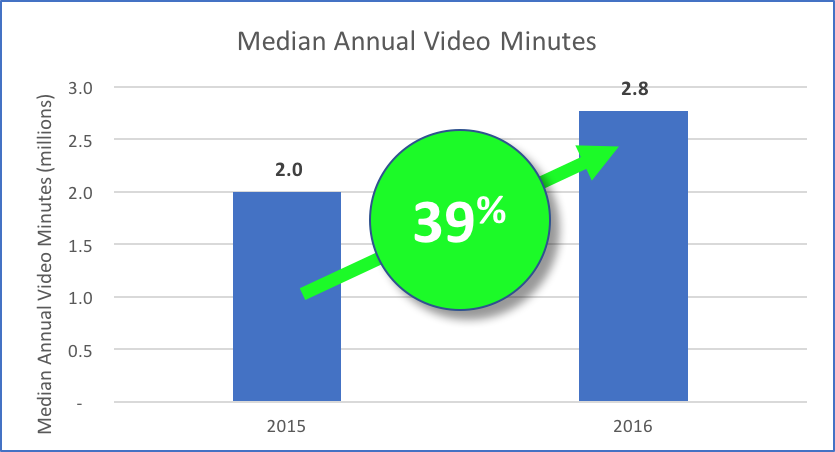
It’s great to know your absolution value of usage, but it is even more important to know how that compares. Is a million minutes a year good? For what size of a company? At Vyopta, we have the data to help you figure that out. One thing I can share here is how annual growth in the consumption of video is consistently increasing over the last two years. An example of this occurring is when the number of median annual video minutes increased by a total of 39% from 2015 to 2016 alone (for Vyopta customers)! This means that organizations are turning to the use of video conferencing as a higher means of communication for both internal and external purposes. Stay tuned for a future ebook where we break these minutes down by endpoint type, call type, protocol and more.
As we said the other day in our webinar – video is growing rapidly (especially for Vyopta customers), and we can help you figure out how you are doing in comparison.
Other facts about video usage
According to Cisco’s visual networking forecast report, IP video traffic on a global scale will take up 82% of all consumer Internet traffic by 2021 from 73% in 2016. With this information, we can expect IP video traffic to grow threefold from 2016 to 2021, which is a compound annual growth rate (CAGR) of 26%.
To add to the consistency of video usage increasing, the number of software video minutes has grown twice as fast as hardware video minutes from 2013 to 2015. Putting aside the different means of communication with video, this indication of video usage rising alone helps us recognize that organizations are putting in the time and effort to use video for connecting with one another.
In other words, as organizations continue to invest in UC&C and train their members how to utilize this technology to work for internal and external communication purposes, the management of video will only continue to grow.
How can you track your UC&C adoption rate?
As your organization invests in more modern technology, what better way to monitor and analyze your UC&C environment than with Vyopta? We help you check on a single platform all the insights you need about your collaboration environment and how you can continue to improve it for your customers and employees! Check us out here.