 We have a huge announcement! Today, Vyopta is happy to announce the first ever analytics tool for WebEx. vAnalytics™ for WebEx™ helps IT managers and administrators to drive adoption, track and manage costs, and improve usage with actionable insights from comprehensive data collection and analysis in our cloud vAnalytics engine.
Why is this a huge announcement? Well, aside from the fact that it has never been done before, it is huge because WebEx is huge. There are over 2.6 Billion Webex Call minutes per month, and over 95% of the Fortune 500 use WebEx. This means there are literally millions of people per day are using a tool that they have no easy way to analyze or optimize!
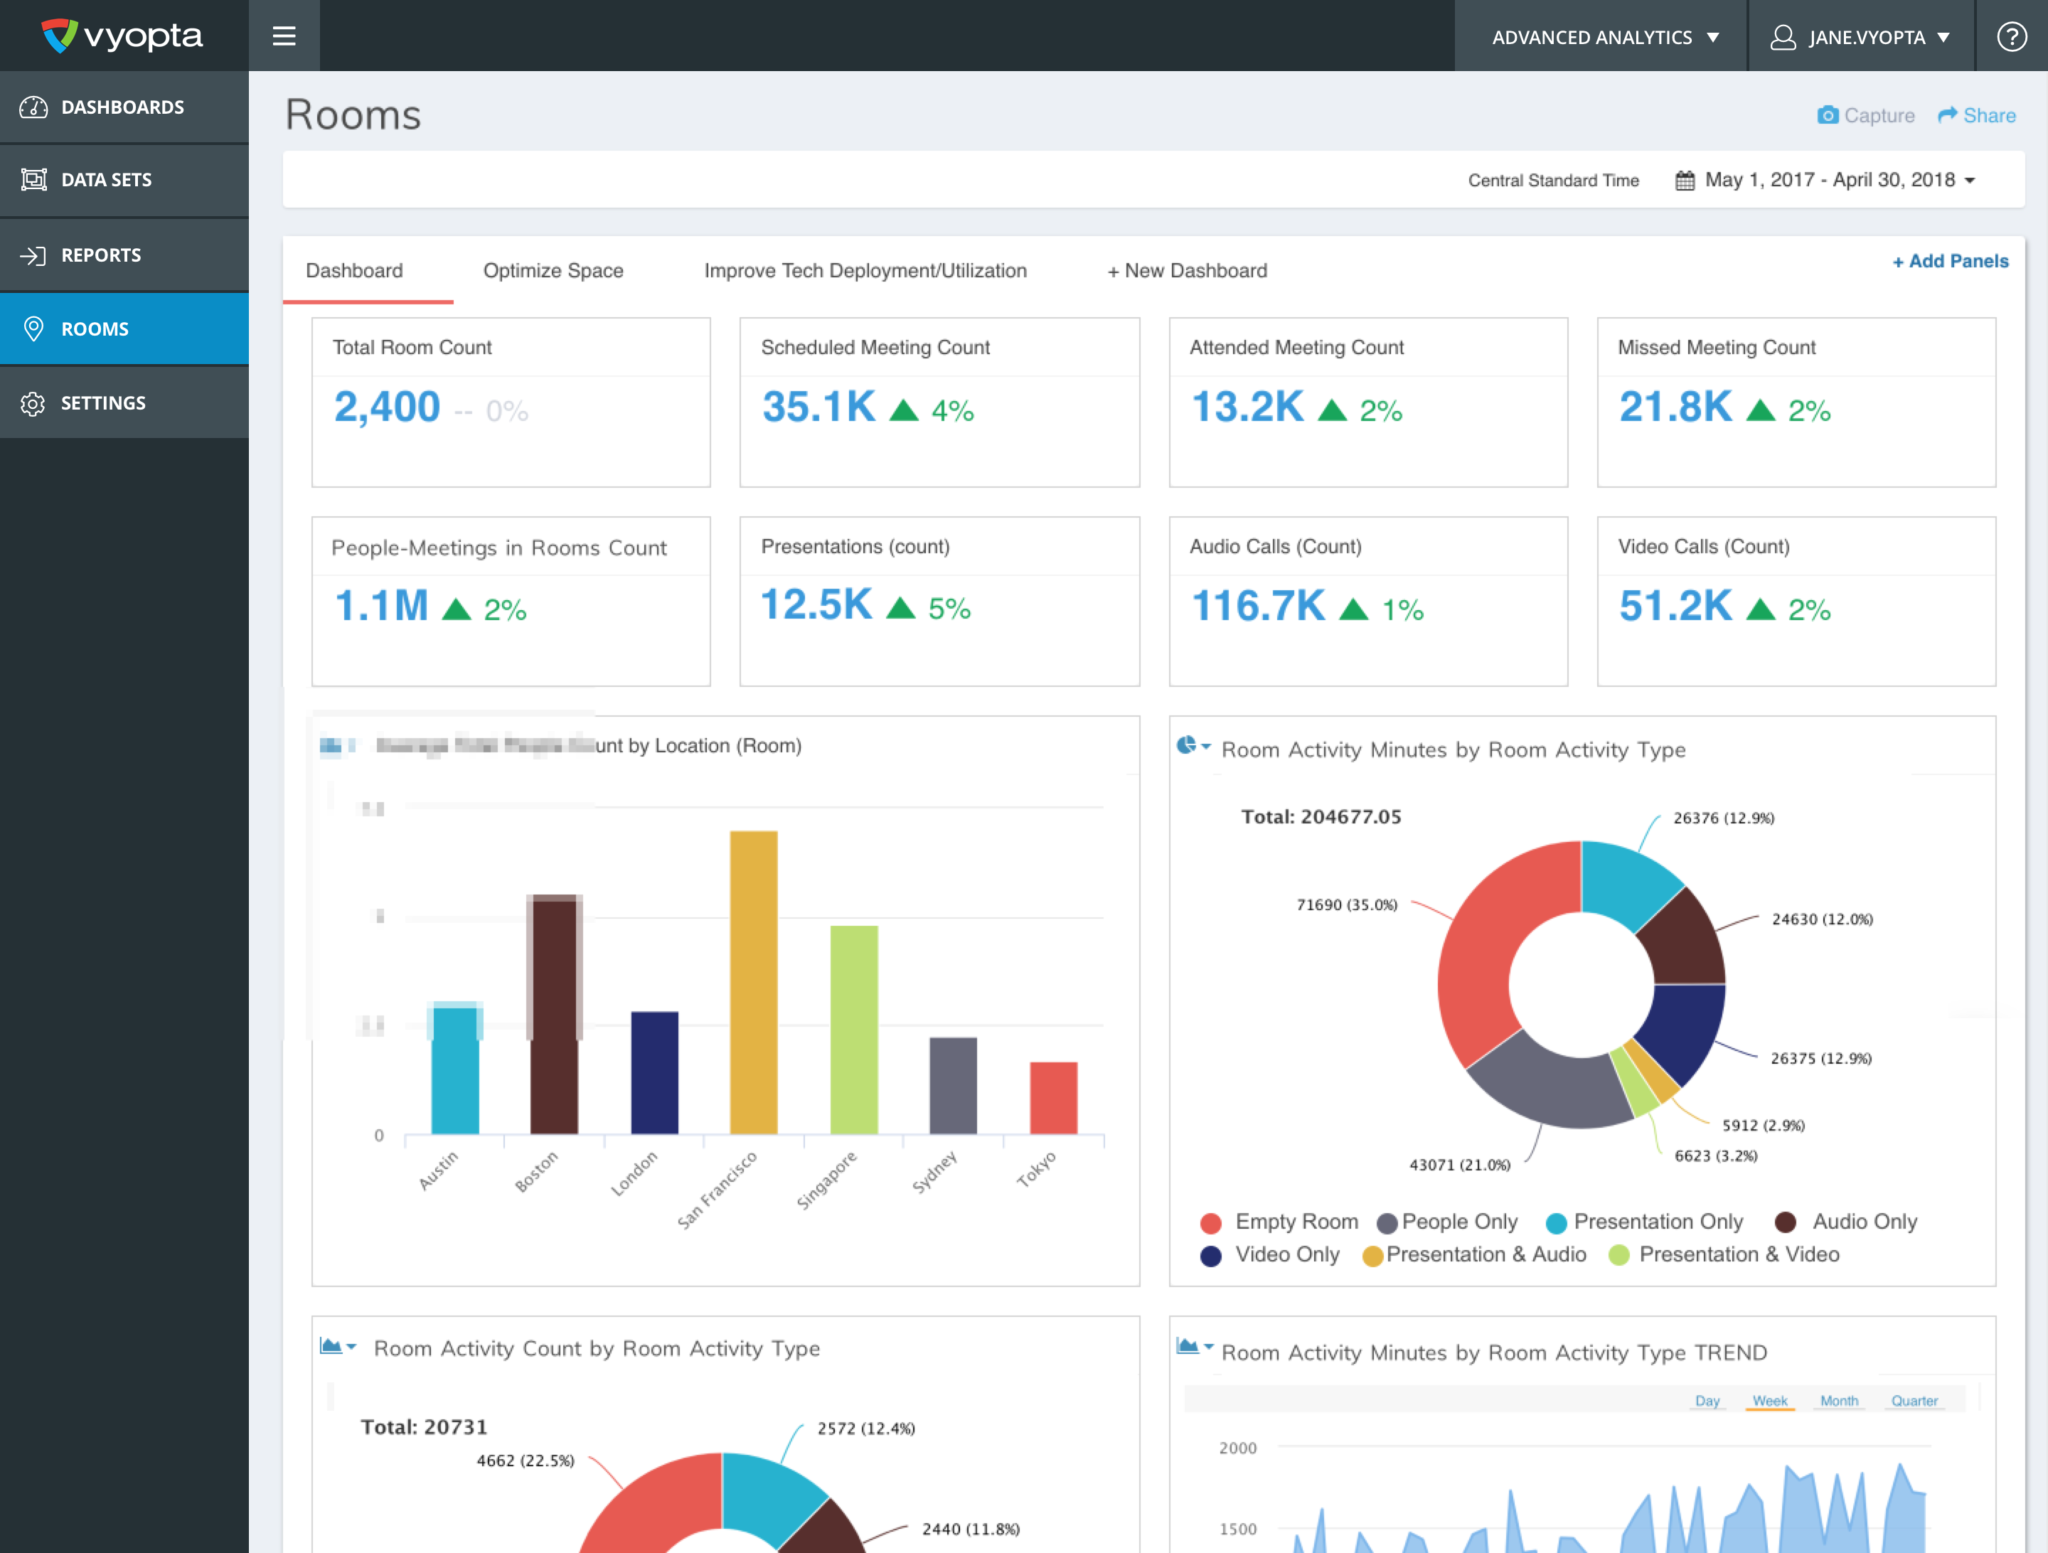
Powerful platforms like WebEx cannot ship in fully optimized configurations for every user right out of the box, and no software can be optimized without the tools to help analyze and configure it. Here are the metrics that you can see today: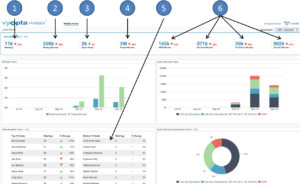
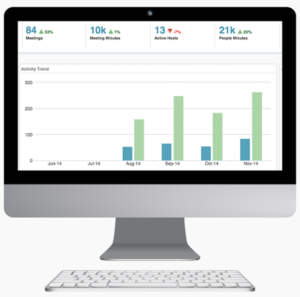
- Total Meetings: This is pretty straightforward. With this metric you can see the monthly trend in how much WebEx is being used through the total number of meetings that happened.
- Meeting Minutes: Another useful trend to know, this tells you how many host minutes you are using. (Pro Tip: Total Meetings/Meeting Minutes = average length of a meeting)
- Active and Registered Hosts: This metric helps you compare who is using your host licenses and if you have the right number of users for your company.
- People Minutes: This is pretty useful as a trend as well, and it reflects the total call in minutes to all of your meetings in all formats. (Another Tip: People Minutes/Total Meetings = average number of people minutes per meeting)
- Top and Bottom Users: The top hosts can be a useful resource to help increase WebEx adoption; learn what they’re doing and tell others. Additionally, the bottom users can be those who experience problems; find out what those problems are and fix them.
- Minute Types: These show you the various audio call in minutes and how they were connected to your meetings. These types drive monthly audio costs which usually happen on a per minute basis.
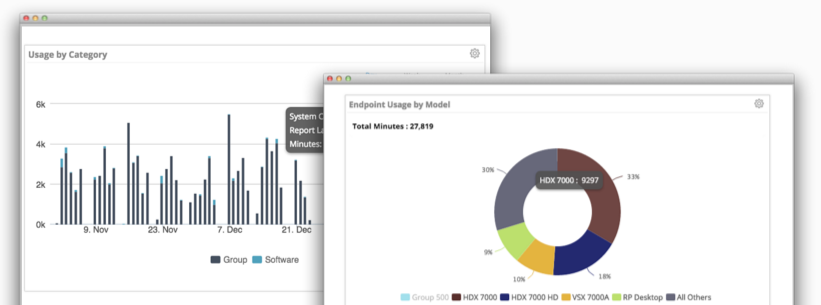
As you can tell there is a ton of useful information here (sign up for a demo to see more than the sneak peek above). The first thing you’ll see if you look closely is a growth indicator similar to a stock market ticker for each metric. This gives every key metric at the top of the page instant relevance.
There are also visualizations for all metrics that help make the data more compelling for reporting and compliance needs. For ease of use, the data can also be viewed according to different time windows and all components can be viewed individually or in aggregate simply by clicking the label in the legend for each panel. Finally, the interface itself is fast and can be personalized for every user of vAnalytics so they can decide which graphs show up in their screens and where.
The goal for vAnalytics for Webex is the same as all of our products: to help IT managers save time, get the most return from their collaboration investments, and be a productivity hero to their companies.
Thanks for your time, and we hope you enjoy vAnalytics for WebEx.