Analytics For Webex, Professional Edition
A few months ago, one of our customers came to us with a dilemma. They were using vAnalytics to manage their telepresence activity, but they had a corporate initiative to combine their WebEx® with Telepresence through a new feature called Collaboration Meeting Rooms (CMRs). They realized a need for this after discovering that people were going into telepresence conference rooms and starting a WebEx at the same time so they could share screens while being on video. Some of you know what I am talking about and realize immediately the intellectually challenging nature of this situation. The act of setting up, starting, and joining two different meetings is redundant and inefficient. We discovered this actually happens more often than you would think.
The customer asked us if we could provide reporting on WebEx to help them power this adoption of the new CMR technology because we already monitor their telepresence and they wanted their users to be able to take advantage of the ease of use and simplicity of WebEx CMR meetings. They have aggressive goals to move a 60,000 person company entirely to cloud-based CMR bridging through WebEx in 12 months. This type of challenge is the reason we exist at Vyopta, so we hopped on board immediately.
The Product: Analytics for WebEx, Professional Edition.
After a ton of hard work, beers from the office kegerator and late nights, we finally arrive today with our launch of the Professional Edition of Analytics for WebEx. We are proud to be the only company offering comprehensive, cloud-based Analytics for WebEx in a single, simple interface.
The following will provide a brief introduction, and explain some of the powerful new features in Analytics for Webex Professional Edition.
THE BEGINNING: SETTING GOALS
I know what you are thinking, “that customer is very unrealistic if they think they can convince 60,000 humans to change their behavior in only 12 months!” However, we had a similar experience with this customer in the past and we knew it was possible because they have a great culture for adapting to new technology. They are a completely data-driven company and have the human infrastructure in place in the form of over 70 “deployment coordinators” to develop and execute adoption plans. What they were missing was a system to gather and analyze the WebEx adoption data to drive and track the progress of their effort…
THE HARD PART
It is not as simple as just giving deployment coordinators a bunch of data and telling them to create spreadsheets. What the deployment coordinators really need is data that is relevant to the organizations and business units they represent. Unfortunately, you cannot get this data from WebEx alone. We solved this problem by integrating and correlating their WebEx data with organizational data fed from an HR system.
Example Hierarchy:
Corporation
>Operating Company (Finance, R&D, Engineering, etc)
>Business Unit (Operations, Accounting, Payroll)
>Department (Corporate, Europe, Asia)
We accomplished this by building an Enterprise Application Integration tool (EAI), that allows us to interface with a wide variety of data structures from Active Directory, Oracle databases, or really any sort of information that we can convert into our database structure. This is an incredibly powerful tool that makes it possible to correlate usage of collaboration from the team level all the way up to the corporate level so that users can easily create custom reports at any level in between or in any combination.
WHY DO YOU NEED CUSTOM REPORTING FOR WEBEX?
This brings me back to the customer. With these deployment coordinators creating their own customized, relevant reports, every team now has the flexibility to create their own plan and adapt along the way. They don’t get handed some training material and rollout plan created by one person in corporate that is supposed to work for 60,000 different people who have completely different jobs and motivations. The deployment coordinators can now develop and track their own adoption plans tailored to the realities and goals of their business unit or organization. This is how they are able to move mountains of people and change behaviors in under 12 months. Custom data analysis is the key to unlocking massive change and moving quickly.
ABOUT ANALYTICS FOR WEBEX
When the data from WebEx is combined with detailed organizational data and a flexible analysis tool, the result is business intelligence.
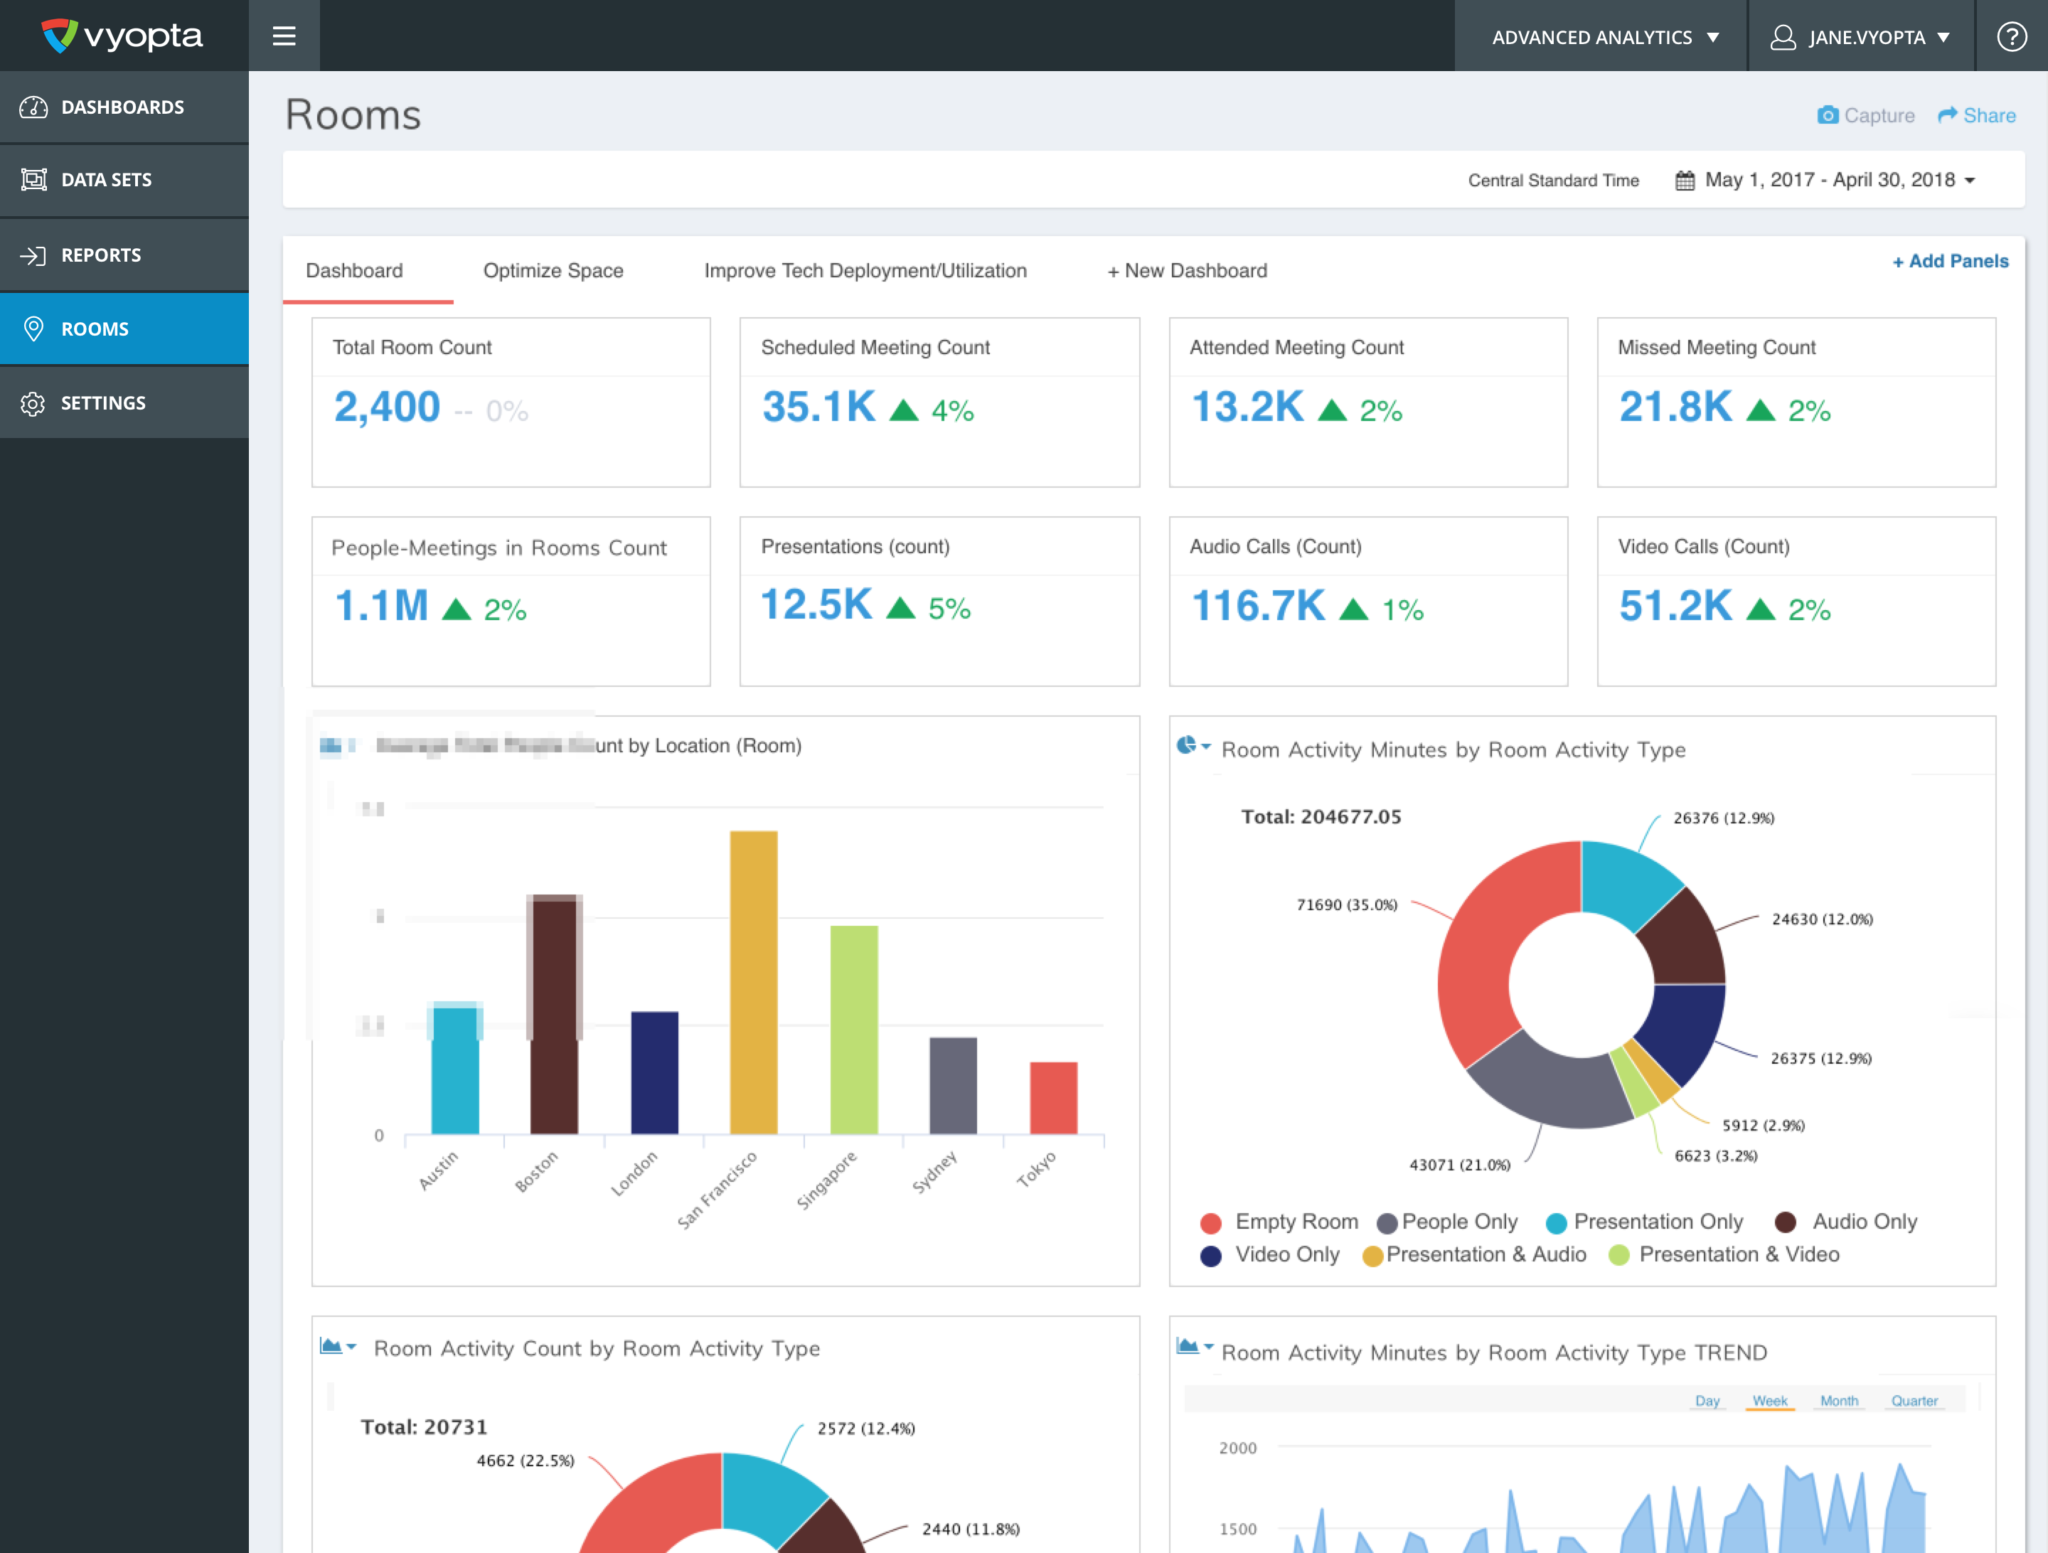
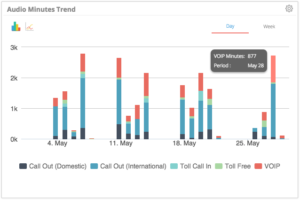
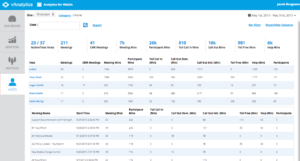
Our product is divided into 4 tabs. First we have the Dashboard.
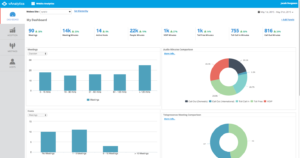
Here you see a snapshot of the usage for the corporation. However, with a few clicks in the category selector using data from the EAI, we can now compare that same data across several business units, teams, or cost centers. How many active or inactive hosts do we have? How many hosts are active with telepresence as well? All of these questions and many more can be answered at the dashboard.
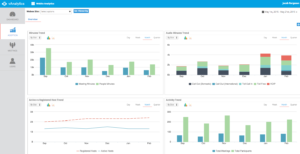
TRACKING ADOPTION
But what if you see a percentage on the dashboard that doesn’t look right? Or if you see a little red indicator next to a key metric that indicates declining usage? You can dig into that specific metric in our Adoption tab. In the Adoption tab we take the key metrics and compare them across time as well as against averages. Again, you can examine these stats across any organizational level, and export the charts and the raw data as well.
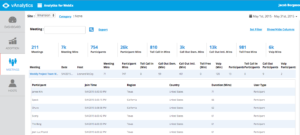
MEETINGS
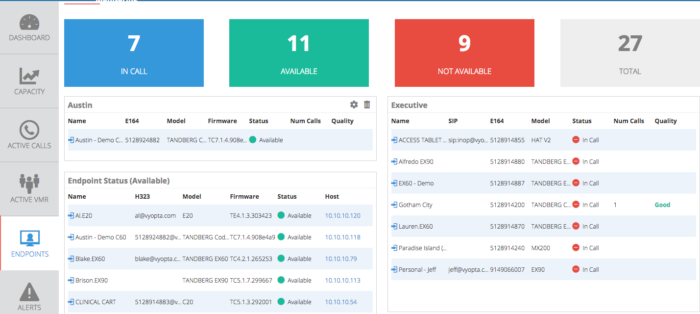
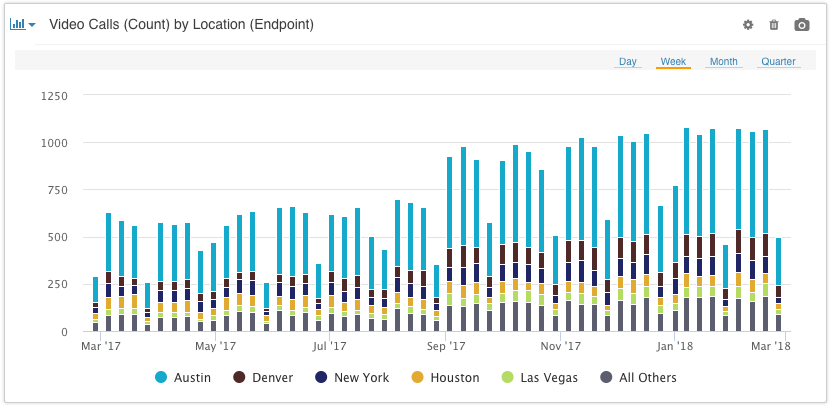
Ok, but what if I am curious about exactly which meetings these activities occurred in? A common example is wanting to know how many meetings had only two participants or less. Those “meetings” belong on phone or video chat services, not WebEx. You can find the visual in the dashboard and then simply click on the graph to go straight to the meeting tab. Here the data is completely open to sorting, filtering, and searching so that you find data across thousands of permutations.
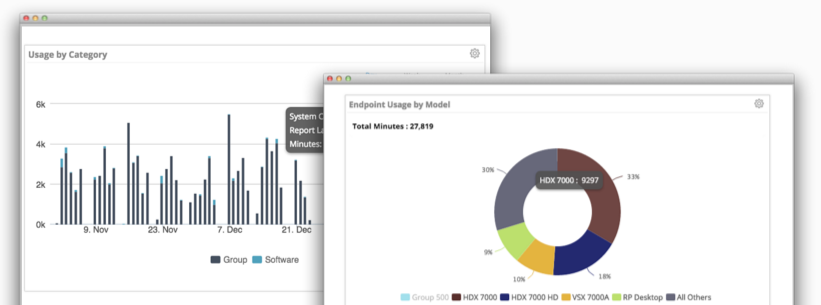
HOSTS
Finally, you can analyze the data by host. You can sort and filter any way you like and then click on each host to see their complete list of meetings, their participants, and how they joined. This is what we call a “deep dive” into the data.
I just scratched the surface here, but hopefully you have at least uncovered one reason to come check the tool out. It is extremely simple to set up, and you can get started and have data delivered to you in as little as 24 hours.