This week we’ve made some updates to our Real Time Monitoring and Alerts Module that launched over one month ago at Enterprise Connect. Let’s dig in and find out what’s new!
Alerts
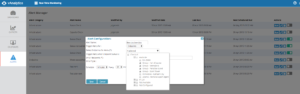
First, we made some key usability updates to the Alerts feature. The “Enabled” notification is now a toggle switch on the right side of the screen instead of a simple status indicator on the left side of the screen. This enables users to turn on and off alerts with a single click instead of having to click through the editor dialogue.
Second, we added the ability to give your alerts specific names. This makes identifying alert emails in your inbox much easier, and even allows for better integration with ticketing systems! We heard your requests loud and clear and this was one update where immediately saw the need. If you created alerts before naming was possible, you will see no change in the way they look, operate, or show up in your inbox. However, we do encourage you to go back and adjust these alerts to make it easier to sort and use them in the future.
Third, we enabled alerts emails to be delivered as Plain Text or HTML. This helps customers channel these alerts into ticketing systems to efficiently assign appropriate call resources.
Endpoint Monitoring
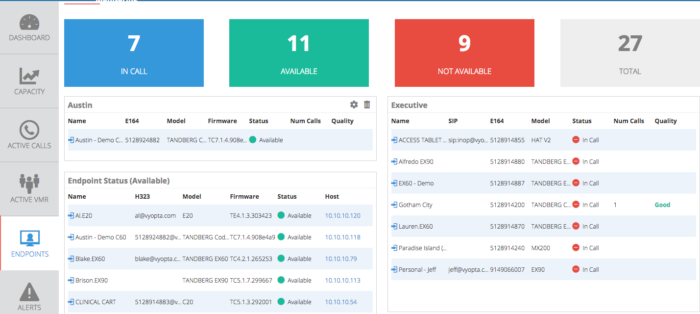
You may notice that you have several endpoints that show up as “Not Available” when they are in fact available. This is a side effect of not being able to collect some presence data for some types of endpoints that are registered to Cisco Unified Collaboration Manager (CUCM). We are working on a fix for this and should have an update soon.
Endpoint Grouping
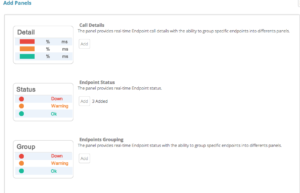
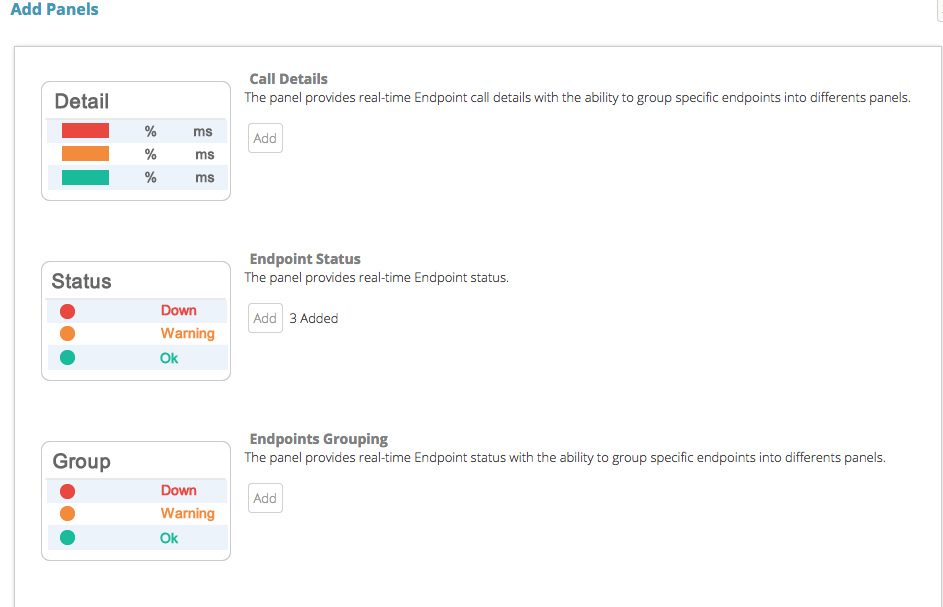
There are a couple of new options for Endpoint panels shown here, one of which is Grouping. This is a flexible method for adding and organizing endpoints according to your needs. Whether it is by type, location, name, or other, you can configure this as you would like.
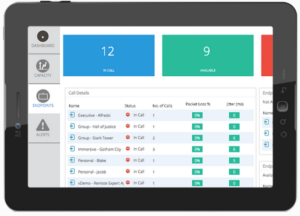
Call Detain Panel
Some adventurous customers may have noticed there are several panels available in the Add Panels window that you may not be familiar with. The first of these is the Call Details Panel. In the future, this is where call quality details for calls in progress will be displayed. We are excited to announce this capability soon, but the panel will not populate any data just yet. Stay Tuned!
Capacity Panel
There are other panels in the tool that will also not populate unless you have the technology installed in your system and have connected it to vAnalytics (see our Deployment Guide). If you add this panel and it shows up empty, then chances are you don’t have Acano infrastructure and don’t need to worry about it.