What We Learned – We Should Help Save Time
We learned that the biggest pain point our customers have is that they lack time. They don’t have time to learn a new tool and they certainly don’t have time to learn the nuances of how different vendors solve the technology challenges of video collaboration. Finally, collaboration managers are frustrated with the complex, vendor-specific tools available today.
In addition, there are a lot of people managing video collaboration for the first time, usually as a “hey can you handle this too” kind of task that bosses and employees everywhere underestimate by about 1000%. We set out 3 years ago to help IT teams and grow videoconferencing, and on the way we discovered there are five keys to simplifying collaboration management and saving users time with analytics:
1.) Make the User Experience Visually Compelling and Intuitive
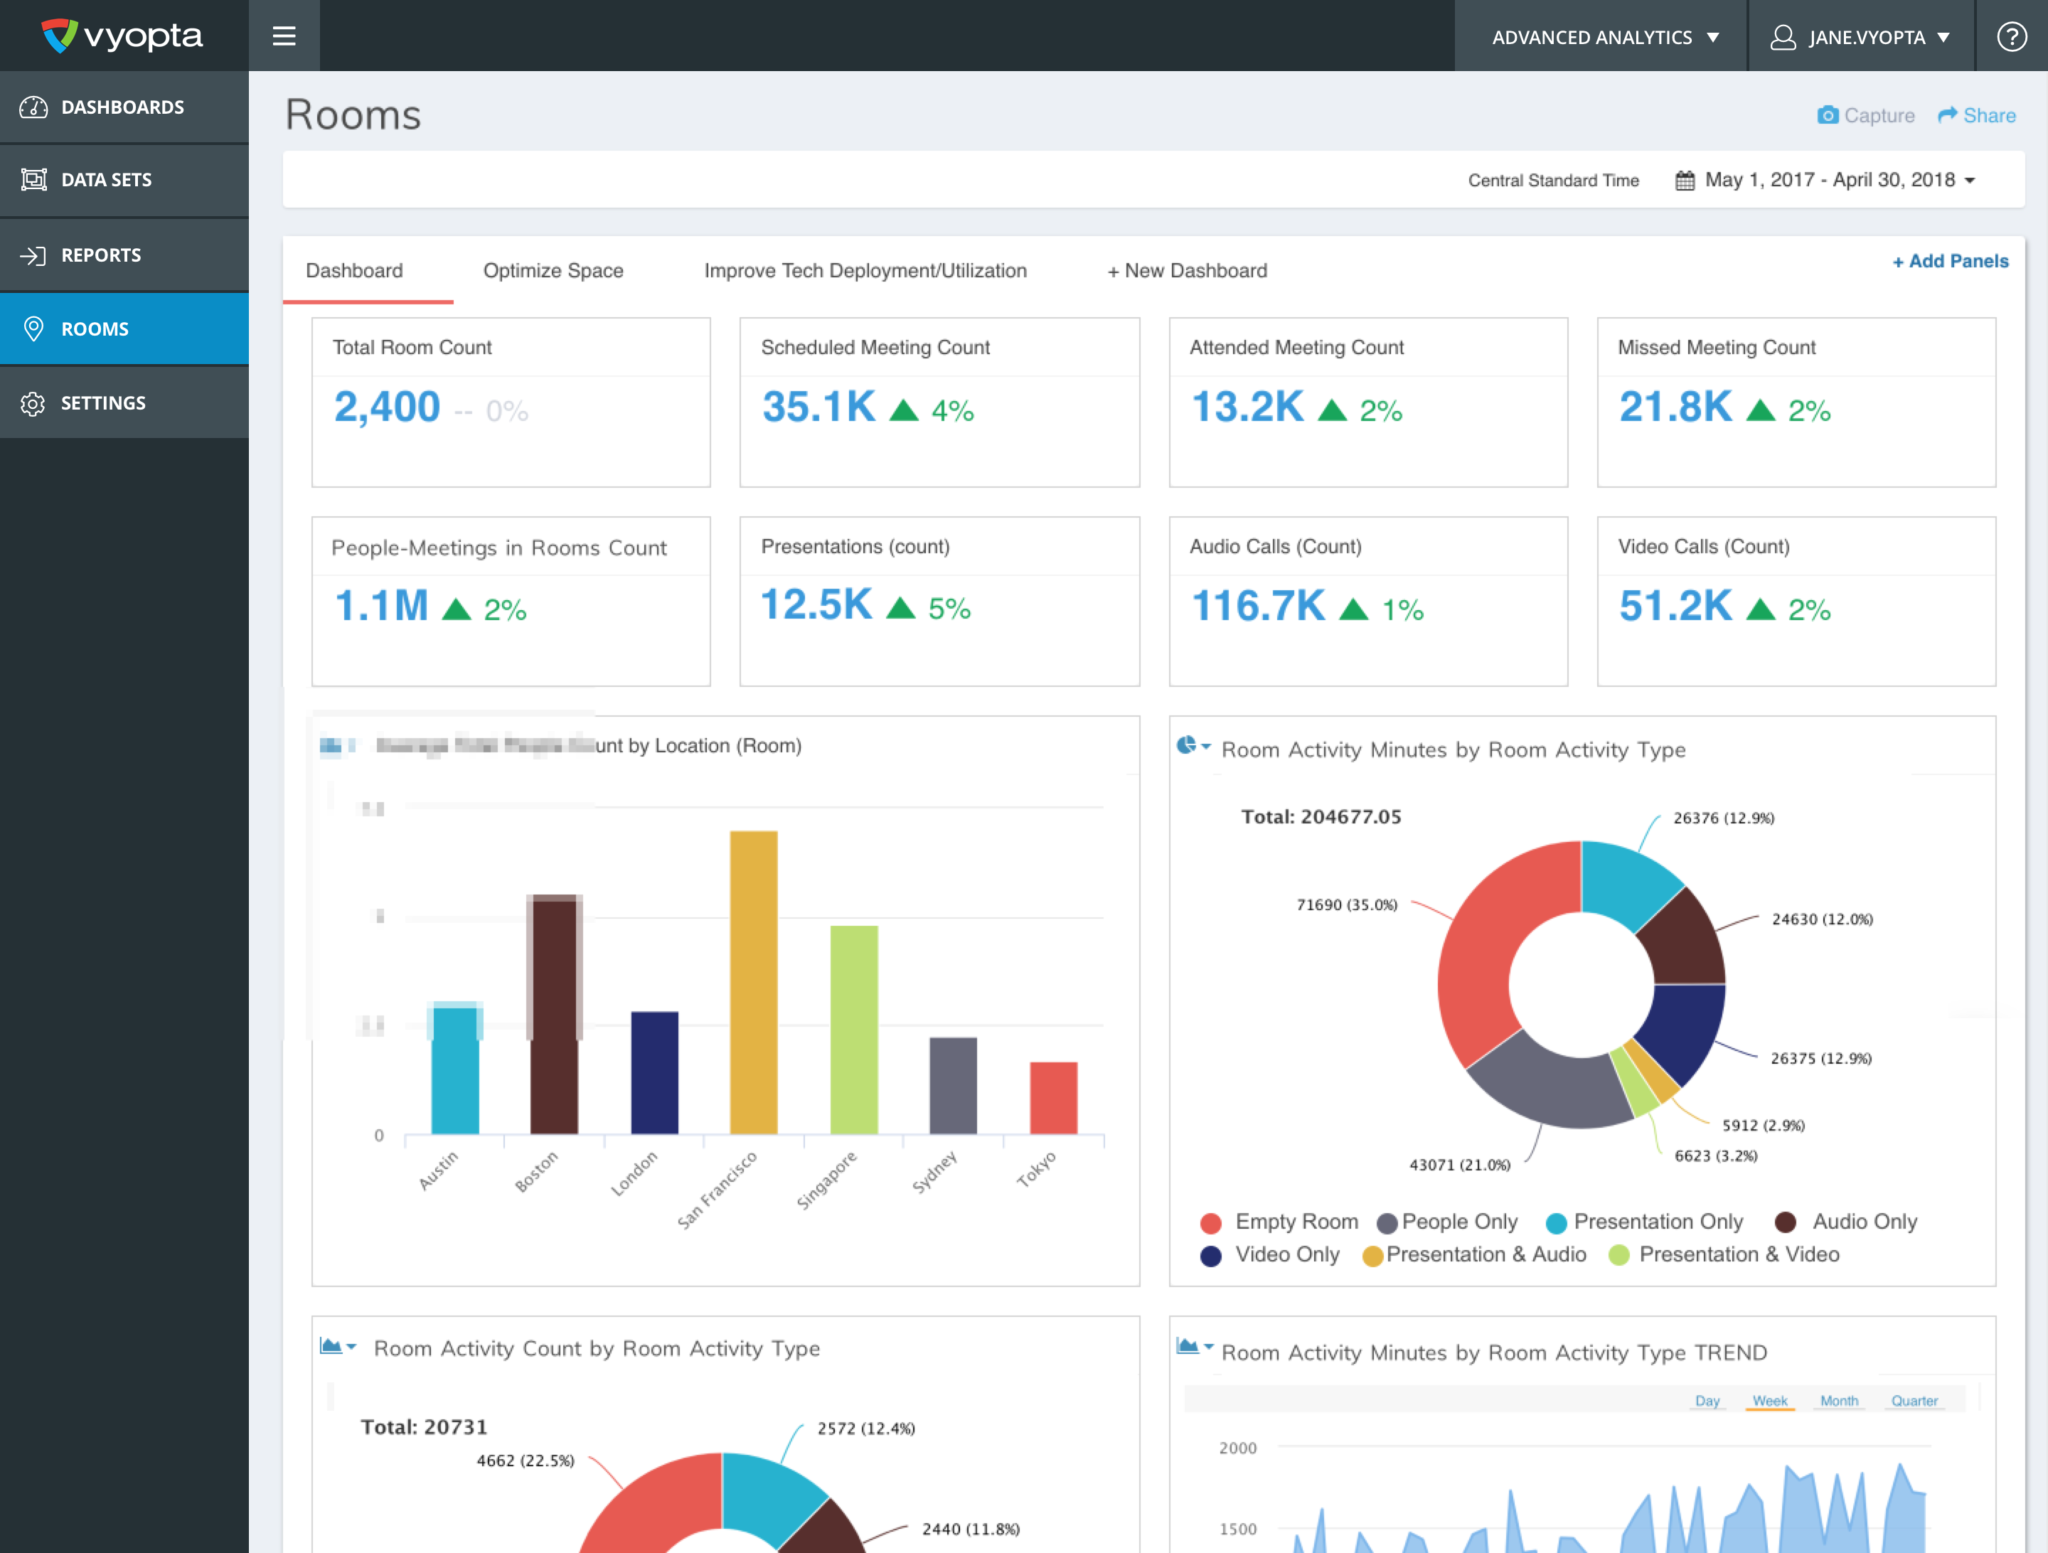
Video administrators and collaboration professionals need to answer 4 big questions: How are our investments being used? Are they working well? Is our adoption growing? Do we have the right capacity for our needs? So we designed our product, vAnalytics, around different tabs designed to answer one of these questions and provide streamlined access to the most important metrics.
For each tab and the product as a whole, our primary focus was making them visually compelling for both aesthetic and functional reasons. For example, the new dashboard gives visual priority to key metrics like total video minutes and meetings and comes with several default panels that display information on Endpoint Usage by category and a full list of infrastructure devices. This immediate gratification combined with the ability to click through each data element makes it extremely simple to understand the most important usage metrics in a few seconds.
2.) Be Accurate and Smart with Diverse Data
Every time we ran into customers that actually put effort into pulling together reports for video technology there always seemed to be two words that came up: “This sucks.”
I am not making that up at all. Not only was the process painful, it was very error-prone. You had to know a lot about how these devices functioned in order to figure out what the spreadsheets were actually saying, and tough luck if you actually had to consolidate information from multiple different devices.
We went through these exercises more than anyone in the history of video collaboration. We have pulled and checked data from hundreds of organizations and through all that we came up with intelligent algorithms and rules to distill what was truly important from the gigabytes of call detail records. We have evolved the necessary framework and intelligence from all our previous work so that insights that previously took weeks can now be done in minutes.
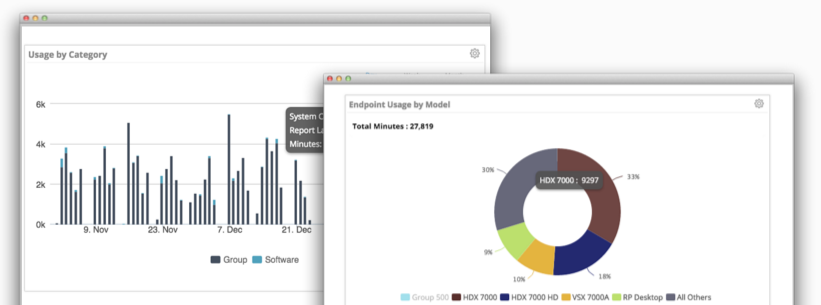
Here are some examples of these insights:
- Endpoint utilization percentage based on an 8 hour day
- Issues and call quality per endpoint
- Bridge Usage by Technology, device, and model
- Most and least used endpoints by type
- And many more
3.) Match User Needs with a Flexible and Customizable Interface
Users were wasting a lot of time hunting through a ton of cryptically-named pages trying to find the report they need. In vAnalytics, we made all the panels interactive and flexible so users can find the data they need, put it front and center, and get right back to it the next time they log in.
Secondly, many of the panels are configurable in terms of the metrics that can be displayed. For example you can view endpoint utilization by video minutes, audio minutes, number of calls, or average call duration. There are other metrics such as Meeting Utilization, endpoint call trends, and call issues that can be segmented in similar ways.
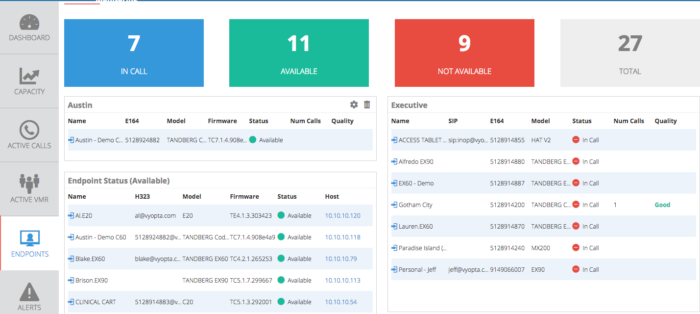
Finally, we are now focused on two main perspectives on usage: devices and meetings. Device usage is the way data was traditionally represented, so we wanted to make sure to continue supporting that. Where we made a huge push was to add the concept of “Meetings.” The move to persistent VMRs instead of one-time, scheduled meetings produced difficulties in measuring what was actually a meeting. How would you tell when one meeting ends and another ends when the meeting name doesn’t change and the room is always open? We applied some intelligence to detect when rooms go to zero participants and call that the “end” of a meeting. Companies now get a better idea of who is using video resources and how they are doing it.
4.) Collect and Unify Data from Multiple Technologies and Vendors
3 years ago, vAnalytics became the first tool on the market to incorporate data from multiple vendors. Now vAnalytics is the only platform in the world where you can see Cisco, Polycom, Pexip, and Acano in a single piece of software. At Vyopta, we know this is important for enterprises with large multi-vendor video collaboration environments, so we took it a step further and starting combining data from multiple vendors in the same tables and graphs by aligning the data received from multiple sources.
We added support for new platforms like Cisco Unified Call Managers and we also made sure to take all the different ways that metrics are reported and connect the real meaning behind the scenes.
5.) Make Sharing and Reporting Simple
The final step in any analysis is sharing the results. We decided to save time here as well by enabling the raw data to be exported from any page. We took it a step further by enabling automated shipping of these reports as well. Now you can save time and involve more people in decisions by sending reports via email every day, week, month, or whatever time range you need.
Some large companies want to set up custom monthly powerpoints where they set every detail down to the color of the graphs. Other companies want to be able to create detailed spreadsheets of call quality to feed into data lakes they can share with their network gurus to help optimize the network performance.
The bottom line is that our customers want access to both the raw and processed data from vAnalytics and they want it in a flexible way. We provide this in our new platform.
Find out how much time you can save. Watch the new historical analytics video demo.
We’re very excited to help get organization started with these comprehensive video collaboration analytics. If you have any questions on how these new additions to vAnalytics can help your organization feel free to reach out to us directly.