Monitoring video collaboration in real time has enabled many companies to scale support and contribute savings to the bottom line so today, I am highlighting some of my favorite lessons from all of our customers who are using device alerts to scale video collaboration. For example – Specialists on Call, the leading emergency telemedicine provider in the US, has been able to increase cart uptime and simplify support by tracking over 500 telemedicine carts in over 300 hospitals without adding any support personnel using Real Time Monitoring (RTM) and Alerts. How does it work?
The Basics
The Alerts pull status information directly from the devices in your network (endpoints, Call Control, Bridging, Gateways, and more) and checks for conditions to be met. If the condition is met (ex. Capacity >50%), then an email is sent to the selected recipient. It’s pretty simple and straightforward. The complexity is all in how you apply these alerts.
Types of Alerts
Today we support 3 basic types of alerts in our RTM product and we are working on more in the future.
-
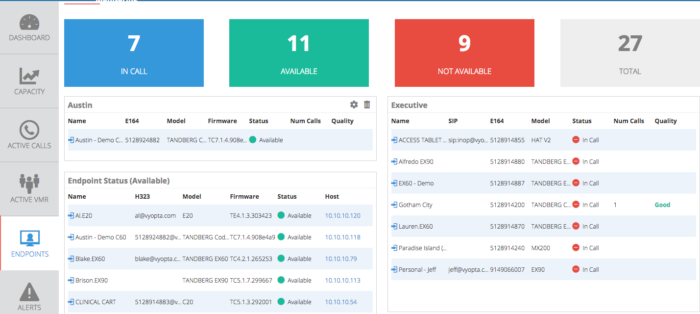
Endpoint Status – This will monitor endpoint status such as available, in call, not available, and not configured and send an alert if an endpoint enters the “Not Available” status.
-
Infrastructure Status – Monitors the Up or Down status of every infrastructure device from Cisco Call Control to Polycom RMX and everything between from Vidyo, Acano, Pexip and more.
-
Infrastructure Capacity – This nifty alert allows users to set a specific threshold of capacity for any of the Infrastructure devices mentioned above, and a time limit for that capacity to be hit. Most people don’t care if capacity is near 100% for a minute or two, but if it is over 10 minutes you might be missing some calls.
Key Features
First, there are a few questions about what “Not Available” means. Not Available means that either the vAnalytics Service installed locally cannot confirm contact with your device (usually a network or credential issue), or that the device is responding that it is in an error state. Both of these situations are bad, but the former doesn’t usually impact your users.
Second, every alert has a few key options that make a big difference in performance.
-
Time Setting: This controls how often the scan runs to test for the alert condition. It is recommended NOT to use the alert setting every minute unless absolutely necessary. 5 minutes is probably a more realistic window to avoid network glitches that can make it look like the endpoint or infrastructure is unreachable.
-
Email address: Here you can add multiple comma-separated email addresses for the intended recipient of an email should this alert condition be met. FAQ: This actually uses a separate email server from Vyopta so there is no need to connect to SMTP or anything like that.
-
End Date: If you only want to run this alert to a certain date, then select that here.
-
Email Type: Enables you to select whether you want an HTML or Plain Text formatted email. Many ticketing systems will accept a plain text email format to create tickets, thereby allowing you to insert any Video Collaboration support problems directly into your normal ticketing system and ensure consistent service.
Best Practice Examples
Monitoring and reporting unavailable endpoints:
Some customers have already asked us if we can use the outputs of the Real Time Monitoring dashboards to send lists of affected endpoints to an operations team that can then prioritize and solve those problems. It is usually pretty shocking for customers when we turn on the service and they see how many disconnected endpoints in their network that they know should be up and running. After the initial shock and fix, it is actually pretty easy to run a daily or weekly report of any endpoints that are down using the Alerts module. Check it out.
Monitoring and reporting on infrastructure peak usage
In this case, the customer kept getting pings for calls not able to connect in the mornings. It didn’t happen all the time or even every day, but it was often enough that they wanted to test a hypothesis. Now, they could simply go look at the daily historical capacity usage, but here is another way to solve the problem and make the Admin and Operations team look like rock stars.
The solution is to create an alert for your capacity every time it hits 85% (or whatever your preference is) of the limit. This way you know in advance if you need to go in and manually load balance calls or tell the scheduling team (if you have one) to schedule any newly requested meetings into a different bridging service. The screenshot below shows how to create this alert.
BONUS: You can see here how I set the alert to only go into effect between 8am and 5pm local time (based on UTC by default). The End Date field is not required so this alert effectively monitors 8-5 every day. I can set a separate alert with a different email address from 5-8 if I want.
These use cases came out of a few customer requests, so if you have any other ideas or questions of what you would like to do with vAnalytics other features, just let us know and we will work on another blog for you!