


Apps Portal (Part 2): Endpoints and Infrastructure

Transcript
Welcome to part two of the Vyopta training module for the Applications (or Apps) portal. This video will focus on the functionality beyond Users and User Access, but for a high level view of the available features in Apps (as well as a deep dive into vyopta administrator’s user functionality), you can always watch the first part of this series. Let’s get started!
As mentioned in the previous video, you can get a look at the status of your Data Collector from the initial Status page. However, if you want to take a more intensive look at the Endpoints and Infrastructure sending data to the collector, we can do that too!
By navigating to Admin and then Endpoints, we can manually add endpoints or view endpoints which have been imported from your local endpoint management platform. Please note that typically, the endpoints will automatically feed from Cisco Unified Call Manager (or CUCM), Cisco Telepresence Management Server (or TMS), or Polycom RPRM (Polycom RealPresence Resource Manager).
Within the Endpoint List, we can search by Name, Description, Host, Endpoint Type, Alias, Dir#, and Monitoring Status. That allows us to quickly and easily find endpoints, even when we’ve auto-imported larger numbers of them (for example with CUCM or TMS).
Please note that non-video endpoints and some desktop video phones may be excluded from this list by default. Additionally, the endpoint list is updated each night so recently added endpoints may not appear until the next calendar day, central time North America. If you have any questions, please let us know at [email protected].
To add an endpoint manually, we’ll select the “+” symbol on the right.
Before we proceed, there is an important note on manually creating endpoints. Please use caution when adding endpoints that are already registered to a management system as this may cause duplicate entries and could result in bad data. A registered call manager should automatically bring in it’s associated endpoints but in order to add an endpoint manually, you will need to know the IP, Endpoint Type, login information, and Registration Alias.
We can see dummy data representing these requirements in the example SX20 shown here.
Back on the Endpoints screen, we can explore the additional Endpoint functionality. For example, if we need to delete endpoints (for any reason), we can use the trashcan icon to remove that endpoint from the list.
… but after doing so, what if one realizes it was done in error? We’ve got you covered! Using the Recycle Icon on the right allows you to restore previously removed endpoint.
We can also check the Endpoint Monitoring Status being returned for your endpoints. Please note that status will only populate if you have implemented Vyopta’s Endpoint Monitor. The available statuses are:
OK – indicating an Endpoint has connectivity to vAnalytics Endpoint Monitor
Not Responding – when vAnalytics Endpoint Monitor is unable to connect to the specific Endpoint
or Login Credentials – when the provided Credentials for Endpoint Monitoring are invalid
Finally, the created date will be the day an endpoint was added or imported into vAnalytics for monitoring. If you have any questions about automatic endpoint insertion, endpoint monitoring, or any facet of deployment… please reach out to [email protected].
Our last focus for today will be the Infrastructures tab of the Apps admin.
This is where you will be able to view the Infrastructural devices added to the vAnalytics Data Collector (or even add them manually). You can also search by System Type, Name, Description, and Host to quickly locate infrastructure. You may have noticed that the functionality here directly parallels the Endpoints area, so all of the same buttons and features apply.
For example, selecting the “+” symbol on the right will allow us to manually add infrastructure.
Please note that while one CAN manually add infrastructure here, typically the devices should be added to the Data Collector installed in your company’s environment. Adding devices here through Apps is not a recommended practice and prevents one from validating access and login information.
That said, if devices are added manually here, you will need to have the name, System Type, Host Address, and the login information for the device.
That’s (more or less) it! There are also Collector Logs for the Professional role mentioned in part 1 of this series, but we’ll be covering that in a future video (no longer available in latest versions). Most of this should be pretty straightforward, but if you have any questions… please don’t hesitate to reach out by emailing [email protected]. We’re happy to help!
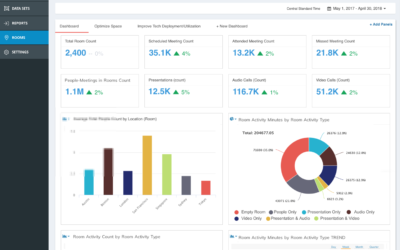
Meeting room management software: Vyopta’s new Room Insights
Insights from existing collaboration, calendaring, and HR systems to improve room and technology utilization AUSTIN, TX (June 5, 2018) Vyopta Incorporated, the leading provider of unified communications and collaboration monitoring and analytics, today announced a new...
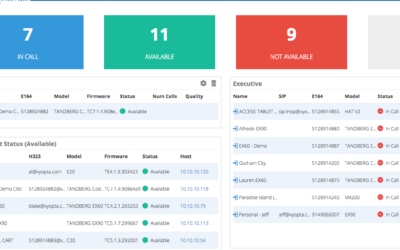
Polycom Troubleshooting Video Conferencing: How to Use Vyopta’s Analytics
Today we announced the addition of support for Polycom RMX, DMA, and Resource Manager devices to our core analytics and real-time monitoring products. We now pull statistics on all devices in the network including Polycom Group Series, HDX and endpoints of any kind...
Real-Time Video Conferencing & Call Quality Monitoring
Recently, Vyopta launched our new upgrade to Real-Time Monitoring and Alerts that includes comprehensive call quality monitoring. Many of our customers liked the way we united capacity and usage information in our Historical and Real-Time products and desperately...