The results of our latest survey stated, 68% of users rate video call experience as the main barrier to collaboration usage and adoption. We know, better than most, that despite video communication and collaboration being a “mature” technology, it is far from perfect in terms of performance. Video conferencing tools can quickly become more of an annoyance than productivity aide. Busy networks can have a huge impact on the visual or audio quality the user’s experience, and even worse, video calls can drop completely. In most enterprises, time is money. So, if it takes more than 5 minutes to start a call, you’re sending money down the drain. Even more dramatic but true, a 5 minutes start delay in the emergency telemedicine world can impact someone’s life.
We work with customers like Specialist on Call, Avera, VistaPrint, the US Department of Veteran Affairs, and more, and found that most large businesses are facing two, primary issues:
- The process of trying to troubleshoot and solve for a video call that went poorly is horrendous and painstaking (to say the least).
- Analyzing overall performance to find root causes is impossible since network monitors sorely lack historical data, and vendor tools cannot pull in call data from outside of their own interface.
This is why we are improving Call Quality Alerts and Call Quality Analysis, so you can easily respond, troubleshoot and work to improve video performance over time.
Improvement #1: Top of the Line Real Time Quality Rating Alerts
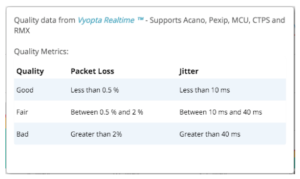
We speak with a lot of customers about the struggles supporting video calls. And yes, you’re that frustrated. Up until now, most troubleshooting consists of unified communication (UC) support teams and engineers trying to recreate the video call failure hours or days later and typically doesn’t work. Those of you using Vyopta can take advantage of our rating system (e.g. Good, Fair, Bad) for video calls.
Now, for the rest of you…
Defining a “Bad” Call: We looked at this support workflow and instead of focusing on gathering data after a call (which we already do, but I will get to that later), we thought the real problem was that support teams have to wait for a user to call in with an issue. In our experience, most users don’t call in most of the time they have a problem. They either restart the call themselves or just switch to audio or web conferencing tools. This is definitely not the desired outcome. On the other hand, if support teams spent hours handling every bad video call they wouldn’t have time to do anything else!
So, we’re happy to announce that we’ve dramatically upgraded our alerts! Detailed updates on quality alerts are already available, and now you will be able to set alerts for call quality so you support teams can focus on other things.
Improvement #2: Resolve Issues with More Quality Analysis Details (Participant and Channel)
The second addition we’ve made so you can improve your user experience was to include all of the unique call data we already collect in our Real Time module into our Historical Analyics module as well. The value in this is pretty obvious. Vyopta users can now analyze calls as a whole, and identify trends and commonalities so they can isolate the root cause of an issue.
Even if a support team can magically recreate an issue accurately, it doesn’t help diagnose the issue. This is because the error codes or syslogs from the infrastructure devices are cryptic and loaded with “junk.” When support tries to reach out to the vendor, they’re expected to send data logs detailing setup, teardown, and all data from when the call took place.
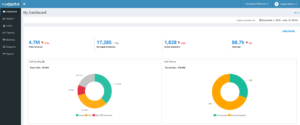
Below is an example of finding commonalities in over 80,000 calls. As you can see, there are quite a few issues with less than 50% “good” calls and less than 40% calls that are connecting. Although several of these are simply misdials, there may be a good chance something is occurring that may need to be addressed.
Remember, you can click on any of the data elements that concern you. I’ve selected the red segment of the Call Quality pie graph on the left (pictured above). The information from this chart segment is displayed below.
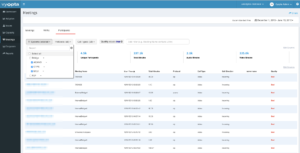
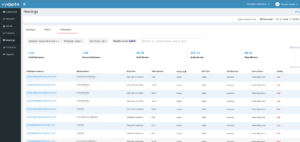
To the top left of the screenshot above, you’ll see an interactive table of all calls. You can click on any call within this list to expand and reveal more details.
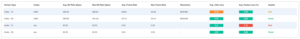
You can identify the specific channel and leg of the call that experienced the quality issue. In this example, the Transmit side of the audio channel was the main problem. This would indicate packet loss was experienced on the internal network. Using this data, the filtering tools above and some sorting, you can quickly identify that 3.2k of the 8400 bad calls are on the Acano protocol (using the Acano client). In addition, the majority of these 3.2k calls (1.8k) are on the specific Acano server. Now, I can download this data and see if the majority of the issues are on the transmit/receive channels.
This is what actionable data (with visuals) looks like and can do for you. You’ll be able to provide to your network team and tell them they need to boost the bandwidth on calls coming into this particular server. Then, check back in a week to see if this has reduced calls with poor call quality.
That’s how easily you can generate a game plan and show how you’ve improved network and call quality performance.
Other Use Cases for Vyopta’s Data
The applications of this data granularity are limitless. You could look at poorly rated calls and isolate those that are remote software clients experiencing issues on personal WiFi (remote callers). This will help you eliminate issues beyond your control. You could also easily identify troublesome servers that are in need of more bandwidth. Or, you could find out which software/hardware device types are creating most of the negative user experiences, and avoid investing in them in the future.
Conclusion
We highlight this data that you get in our newest release because it is something you cannot get from any other tool. The only other way to get this level of call quality detail is to deploy expensive and complex traffic analysis hardware, and that still will not provide you individual call ratings. We are only bragging a little bit when we say this is the type of analysis and insight that makes Vyopta worth your time and resources so that you can grow collaboration and save yourself time in the long run.