While almost everyone else was hitting those resolutions hard and/or sleeping off the Holiday frenzy, our engineers were hard at work adding new features to vAnalytics. Today we have the pleasure of unveiling them to the world.
Concurrent Bandwidth and Concurrent Calls
Something that comes up with customers pretty often is challenges around planning video and UC deployments. One of the biggest challenges is understanding the bandwidth needed to support excellent video experiences in the office. Bandwidth for businesses is a lot more expensive than regular consumer bandwidth – to the tune of 5-10x more expensive because of the need for reliability and flexibility. Since video calls take up multiple Mbps per call, it is important to know two things per Location/office:
- The peak concurrent calls per location
- How much bandwidth those calls consume
Vyopta can now show you this information on a per-location basis. Location is a custom field that can be automatically created from an existing table in something like Active Directory or Exchange, or it can be manually created and edited for custom collaboration management purchases. You can find more about that tagging process here. To get the maximum benefit out of this new feature, it is highly recommended that you use your sites or offices as the Location field. In other words, you should mimic however you allocate bandwidth across your enterprise (QoS, VLAN, other) for Locations in Vyopta (building, office, floor, city, etc). We have enabled other new fields for more extensive breakdowns of adoption or usage by region, city, state, or any other custom method. You can contact us today if you would like to set that up.
Here is a short video on how to add Concurrent Call and Bandwidth panels and how to use them.
Infrastructure Availability
We currently support Endpoint Availability metrics by monitoring uptime and downtime. This monitoring started in October. In December, we started tracking Infrastructure uptime as well. You can now look back to December 1st and see how much overall time all your gateways, bridges, and collaboration servers have been “up.” In the future, we hope to produce SLAs on Availability so that our customers can set goals like “5 nines” and more to help improve user experience and save money.
It is important to note that Infrastructure Up/Down only began being measured on October 16, 2017. When you select a date range that is previous to that, the calculation only uses the amount of time monitored as the denominator. Because we are based on UTC, there may be a part of your workday (depending on timezone) that was counted as down the very first day we started monitoring. Also, an important note is that Cloud infrastructure like Zoom and BlueJeans will not show this information correctly since they have a different connection methodology than on-premise infrastructure.
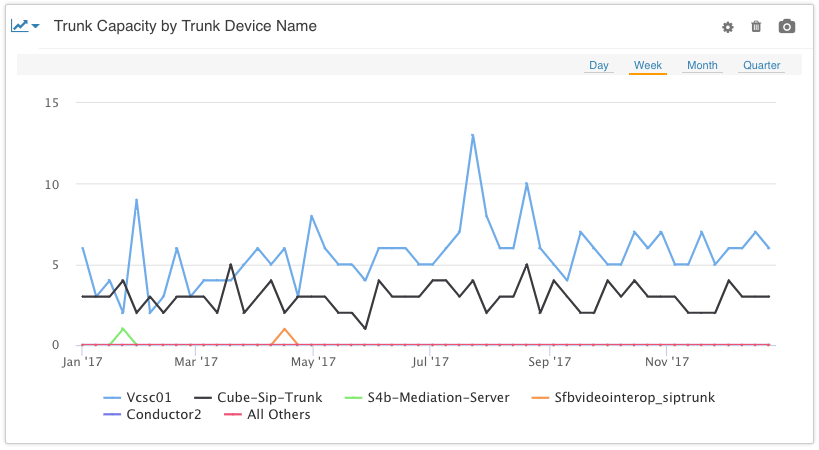
Audio Trunk Capacity
Today we support the monitoring of trunk usage for all types of trunks that are connected to a Cisco Unified Communications Manager. This includes SIP, H323, MGCP, PRI, TDM, and more. We can show you how many calls are going through each trunk, your peak usage per day/week/month/quarter, and you can drill through each peak to see the call details down to the 10-minute interval.
Other Updates
Direct monitoring of Polycom Group Series endpoints – now you can get more extensive call performance data in real time and advanced analytics for these popular room devices. Various bug fixes – we don’t like bugs, so we squash them. That’s it for this month! We have big plans in February, so stay tuned! Also, to make sure you can take advantage of these features, be sure to check that you have the latest version of our data collector installed (Now with Release Notes!).