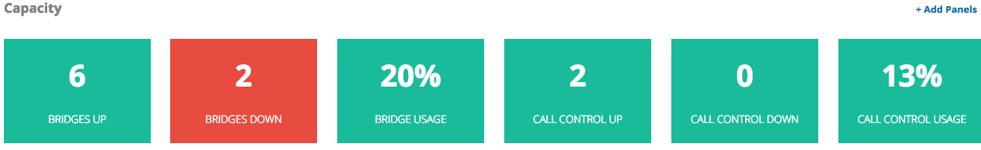
Capacity (Real Time)
The Capacity tab provides a more detailed view into the real-time status of your infrastructure.
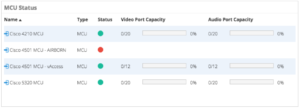
- MCU Status

This panel provides status for MCUs and TelePresence Servers.
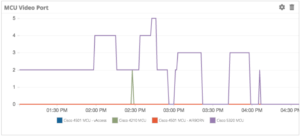
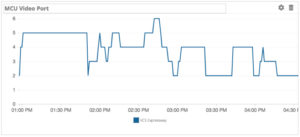
- MCU Trend
Trend lines showing usage over time for the MCU assets. The user can select whether video or audio port usage is being displayed.
- VCS Status
This panel provides status for VCS and Expressway devices. Displays the availability and status according to the same limits in the MCU status panel. <60% is Green, 60-80% is Orange, >80% is Red.

- VCS Trend
Trend lines showing usage over time for the VCS assets. The user can select whether traversal or non-traversal usage is being displayed.
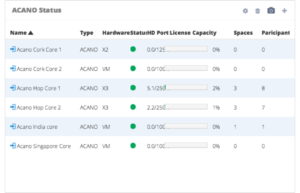
- Acano Status
This panel provides status for Acano CoSpace Servers:- Hardware – Displays how the Acano server is deployed; X2, X3, or VM (Virtual Machine)
- Status – Whether the server is up or down
- Capacity – The fraction of HD Ports used/available
- Spaces – The number of Spaces (VMRs) in use
- Participants – The total number of active participants
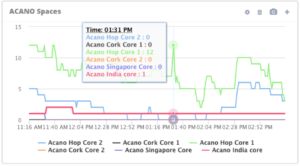
- Acano Trend
Trend lines indicate usage over time of Acano Spaces. The user can select whether spaces or participants are being displayed.
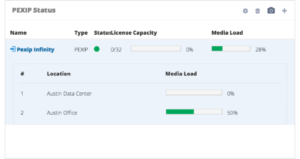
- Pexip Status
This panel provides status for Pexip Infinity at a Management and Location Node level.- Status – Indicates whether all servers are available and communicating with vAnalytics Data Collector
- Capacity – The number used and available Pexip VMR licenses
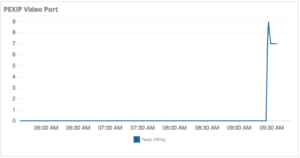
- Pexip Trend
Trend lines of Pexip Call license usage over time.
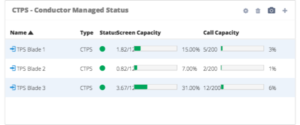
- Cisco Telepresence Server (CTPS) Status
- Status – Colored circle indicates status
- Type – Indicates type of server
- License Capacity – Ratio of screen licenses consumed to total screen licenses, together with a colored usage bar and percentage indicator
- Port Capacity – Ratio of audio or video capacity consumed to total capacity, together with a colored usage bar and percentage indicator
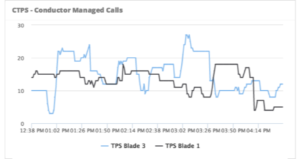
- Cisco Telepresence Server (CTPS) Trend
Trend line showing usage over time for Conductor Managed or standalone TPS assets. The user can select whether screens or call usage is being displayed.
- MCU Status
This panel provides status for MCUs and TelePresence Servers.
- VCS Status
This panel provides status for VCS and Expressway devices and displays the availability and status according to the same limits in the MCU status panel. <60% is Green, 60-80% is Orange, >80% is Red.
- Acano Status
This panel provides status for Acano CoSpace Servers:- Hardware – Displays how the Acano server is deployed; X2, X3, or VM (Virtual Machine)
- Status – Whether the server is up or down
- Capacity – The fraction of HD Ports used/available
- Spaces – The number of Spaces (VMRs) in use
- Participants – The total number of active participants
- Pexip Status
This panel provides status for Pexip Infinity at a Management and Location Node level.- Status – Indicates whether all servers are available and communicating with vAnalytics Data Collector
- Capacity – The number used and available Pexip VMR licenses
- Cisco Telepresence Server (CTPS) Status
- Status – Colored circle indicates status
- Type – Indicates type of server
- License Capacity – Ratio of screen licenses consumed to total screen licenses, together with a colored usage bar and percentage indicator
- Port Capacity – Ratio of audio or video capacity consumed to total capacity, together with a colored usage bar and percentage indicator
- MCU Trend
Trend lines showing usage over time for the MCU assets. The user can select whether video or audio port usage is being displayed.
- VCS Trend
Trend lines showing usage over time for the VCS assets. The user can select whether traversal or non-traversal usage is being displayed.
- Acano Trend
Trend lines shows usage over time of Acano Spaces. The user can select whether Spaces or participants are being displayed.
- Pexip Trend
Trend lines of Pexip Call license usage over time.
- Cisco Telepresence Server (CTPS) Trend
Trend line showing usage over time for Conductor Managed or standalone TPS assets. The user can select whether screens or call usage is being displayed.