Dashboard (Real Time) Call Monitoring
The Dashboard tab aggregates real-time information to provide a high-level view into the performance of your collaboration environment.
SUMMARY
The Dashboard tab provides insights into the status and quality of your unified communications Ideally, this page will be “green,” lacking high peaks in utilization that would indicate potential issues. Our customers often find it helpful to display this view on wall monitors to provide system administrators a quick visual assessment. If additional detail is required, the administrator can then access vAnalytics through a laptop, desktop, or mobile browser.
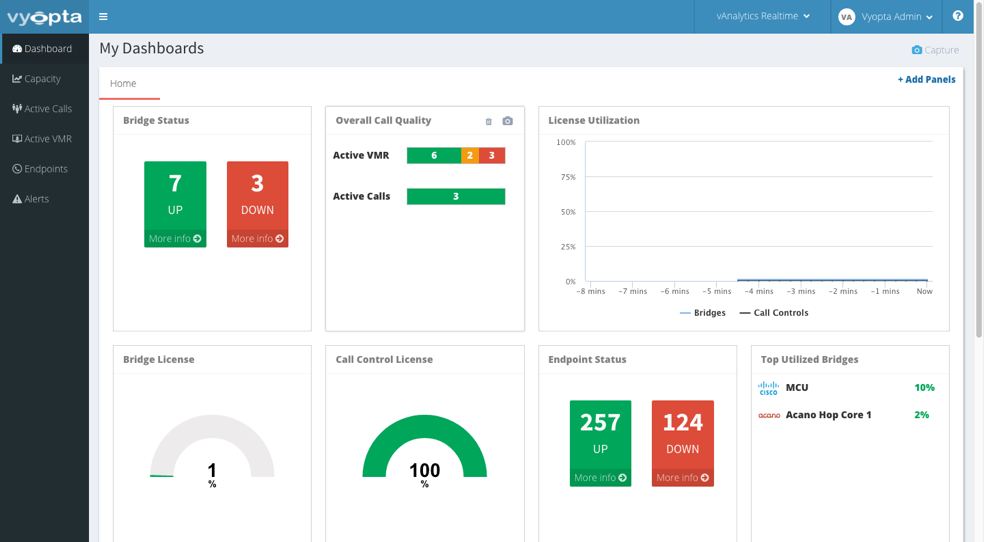
DASHBOARD PANELS
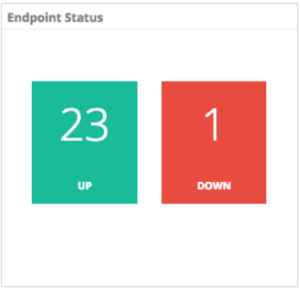
- Endpoint Status

The number of endpoints in each of the following statuses: In Call; Available; Not Available. Status information is collected from the device that maintains all registration information – e.g., TMS, Cisco UCM, Polycom RPRM, VCS, Acano Manager, or Pexip Manage – providing the availability of each registered endpoint and its gateway status.
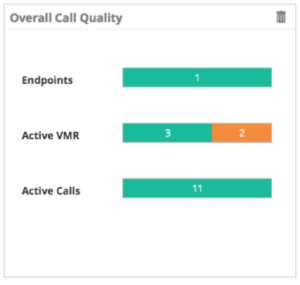
- Overall Call Quality
The number of calls by monitoring source (e.g., Endpoints, Active VMR, Active Call), and color coded quality performance of those calls (as determined by packet loss and jitter).- Good = Packet Loss < 0.5% and Jitter < 20ms
- Fair = Packet Loss < 2.0% and Jitter < 50ms
- Bad = Packet Loss > 2.0% and Jitter > 50ms
This data is collected from the bridges for Active VMR, the call control for Active Calls, and the Endpoint Monitor for endpoints.
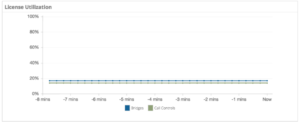
- License Utilization
A visual summary of the percentage of call control and bridge capacity used for all monitored devices. This is a cumulative graph of the latest either minutes of operation.
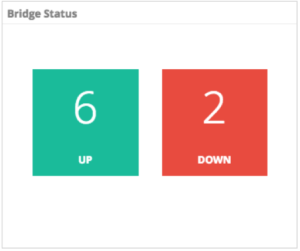
- Bridge Status
Total of bridges that are either “up” (operational) or “down” (not communicating, in error state). This data comes from the Vyopta Data Collector which talks to the bridges continuously.
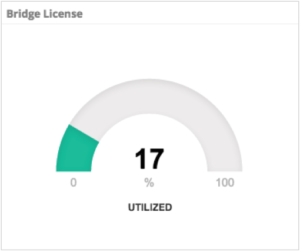
- Bridge License Utilization
Shows the current cumulative percentage usage (or availability) of bridge resources. This data comes directly from the bridges themselves.
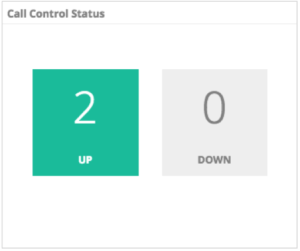
- Call Control Status
Total of call control devices that are “up” (operational) or “down” (not communicating). This data comes from the Vyopta Data Collector.
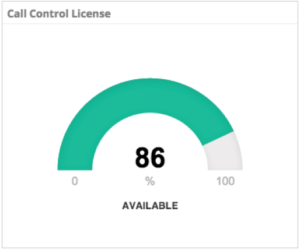
- Call Control License
Shows the cumulative percentage usage of call control device resources. This data comes from the comparison of active calls divided by the total capacity that the Vyopta Data Collector updates on a daily basis.
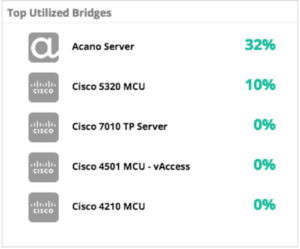
- Top Bridges by Usage
Lists of the current, top five bridges by utilization (calls/capacity). This data comes from monitoring active participants and comparing to total capacity that is measured on a daily basis.
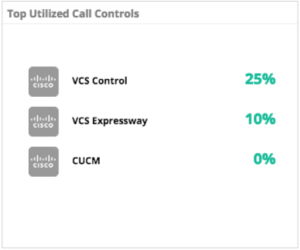
- Top Utilized Call Controls
Lists of the top five call control devices that currently have the most resource usage by comparing current active calls to call capacity that is measured on a daily basis.
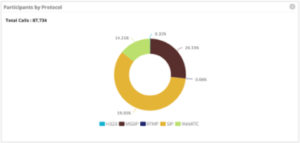
- Participants by Protocol
The new Participants by Protocol Panel displays the total distribution of participants by protocol type (WebRTC, Skype, SIP, H323, etc.) out of all calls.
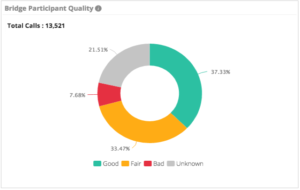
- Bridge Participant Call Quality
This new panel displays the overall call quality rating for any calls that happened on VMRs (TPS, MCU, Acano, Pexip, RMX, etc.) in the selected time period. Good, Fair and Bad are defined in the tool tip for this panel. Unknown quality means the call was either not monitored or quality data did not exist at that time (before May 2016 product update).
- Endpoint Status
The number of endpoints in each of the following statuses: In Call; Available; Not Available. Status information is collected from the device that maintains all registration information – e.g., TMS, Cisco UCM, Polycom RPRM, VCS, Acano Manager, or Pexip Manage – which provides the availability of each registered endpoint as well as its status with the gateway.
- License Utilization
A visual summary of the percentage of call control and bridge capacity used for all monitored devices. This is a cumulative graph of the latest eight minutes of operation.
- Bridge License Utilization
Shows the current cumulative percentage usage (or availability) of bridge resources. This data comes directly from the bridges themselves.
- Call Control License
Shows the cumulative percentage usage of call control device resources. This data comes from the comparison of active calls divided by the total capacity that the Vyopta Data Collector updates on a daily basis.
- Top Utilized Call Controls
Lists the top 5 call control devices that currently have the most resource usage by comparing current active calls to call capacity that is measured on a daily basis.
- Bridge Participant Call Quality
This new panel displays the overall call quality rating for any calls that happened on VMRs (TPS, MCU, Acano, Pexip, RMX, etc.) in the selected time period. Good, Fair and Bad are defined in the tool tip for this panel. Unknown quality means the call was either not monitored or quality data did not exist at that time (before May 2016 product update).
- Overall Call Quality
The number of calls by monitoring source (Endpoints, Active VMR, Active Call), and color coded to indicate quality performance for your calls (as determined by packet loss and jitter).- Good = Packet Loss < 0.5% and Jitter < 20ms
- Fair = Packet Loss < 2.0% and Jitter < 50ms
- Bad = Packet Loss > 2.0% and Jitter > 50ms
This data is collected from the bridges for Active VMR, the call control for Active Calls, and the Endpoint Monitor for endpoints.
- Bridge Status
Total of bridges that are either “up” (operational) or “down” (not communicating, in error state). This data comes from the Vyopta Data Collector which talks to the bridges continuously.
- Call Control Status
Total of call control devices that are “up” (operational) or “down” (not communicating). This data comes from the Vyopta Data Collector.
- Top Bridges by Usage
Lists the current top five bridges by utilization (calls/capacity). This data comes from monitoring active participants and comparing to total capacity that is measured on a daily basis.
- Participants by Protocol
The new Participants by Protocol Panel displays the total distribution of participants by protocol type (WebRTC, Skype, SIP, H323, etc.) out of all calls.