Endpoints (Real Time)
The Endpoints tab provides a detailed view into the real-time data of individual endpoint assets in your collaboration environment.
ADDING ENDPOINT PANELS
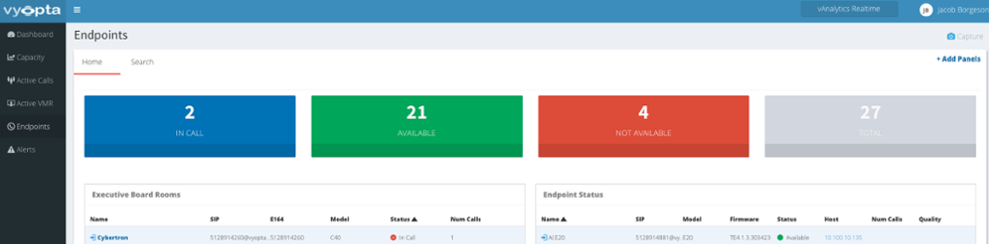
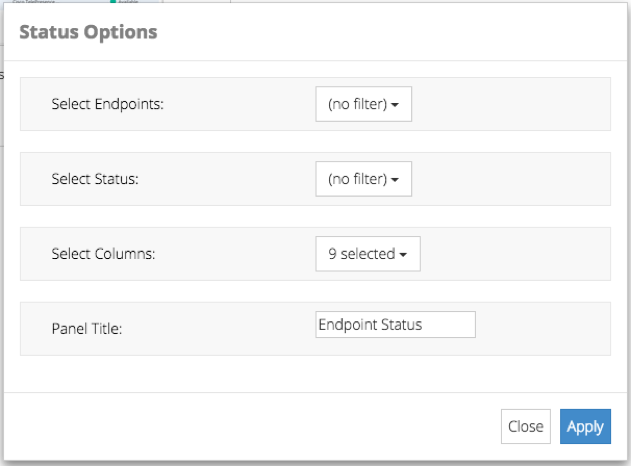
Below the summary, you can add panels that yield more specific insights. Panel creation allows you to choose what information to display from the setting/options dropdown menu (gear icon in the top right corner of each panel). You can configure each individual panel with any combination of the following options:
- Call Status: Display only endpoints with selected status(es) – In Call, Available, Not Available, Not Configured, Select All.
- Endpoint Names: Multi-select a custom list from the full list of all the endpoints registered in your environment.
- Column Selections: can select the columns that you wish to display from the following list: Name, No. of Calls, Packet Loss %, Jitter, SIP URI, E164 alias, H.323 alias, Model, Firmware, Status, Call Quality, Host Address.
- Title: Name the panel for future reference. You can also do this at any time from the Endpoints screen by clicking on the title bar of the panel, typing your name, and then pressing Enter.
ENDPOINT DETAILS
Endpoint Details are available for either managed devices or endpoints in use with the new Vyopta Endpoint Monitor. Please note that endpoint details are greatly enhanced by using the Endpoint Monitor. If you’d like more information on the Vyopta Endpoint Monitor, please reach out to [email protected] for more information. We’re happy to help!
In the example below not only is this device being monitored (as evidenced by the camera and display icons) but it is also integrated with SolarWinds. For more information on our SolarWinds integration, please check out the post our blog experts made in Sept 2016. By clicking on an endpoint name, you’ll get a view of the endpoint that includes details brought in from a call manager or Endpoint Monitor (as applicable), as well user configured fields.
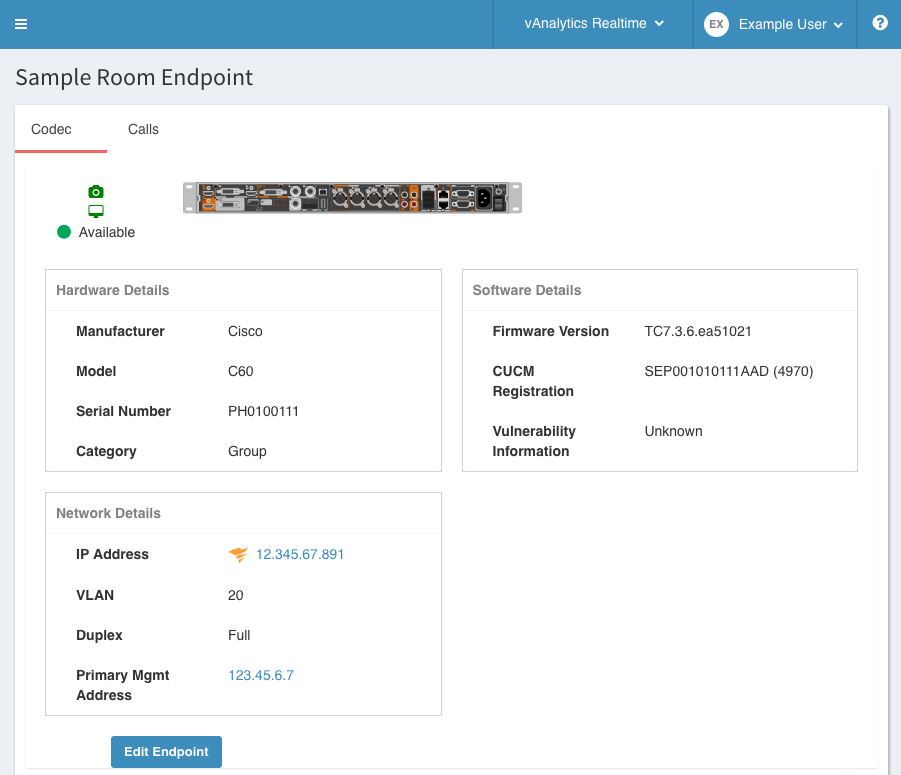
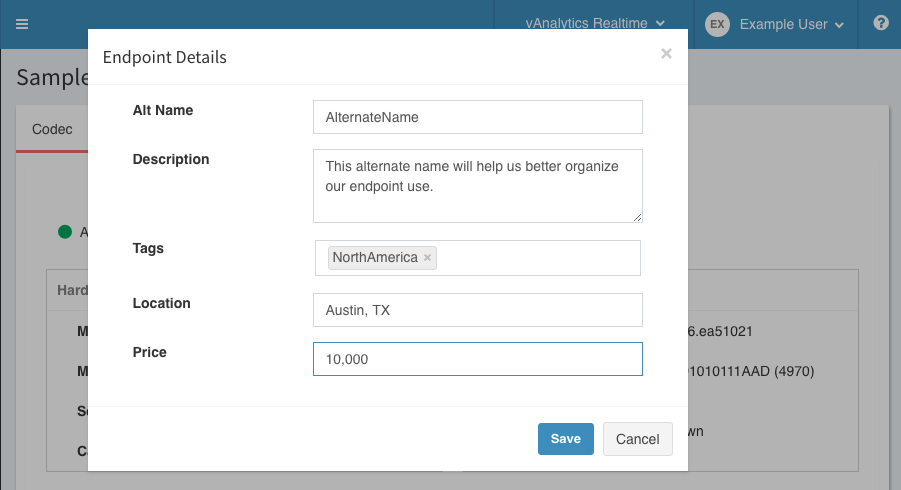
From here, you can check Endpoint Quality (covered in the next section of this page) by switching to the Calls tab or Edit Endpoint to modify the user configurable fields. In the example below, we set an Alt Name as well as an associated endpoint Location and Price. Another key note is the addition of a user configurable tag. Tagging has been enabled for search and will receive significant enhancements in a future release, so stay tuned!
ENDPOINT QUALITY
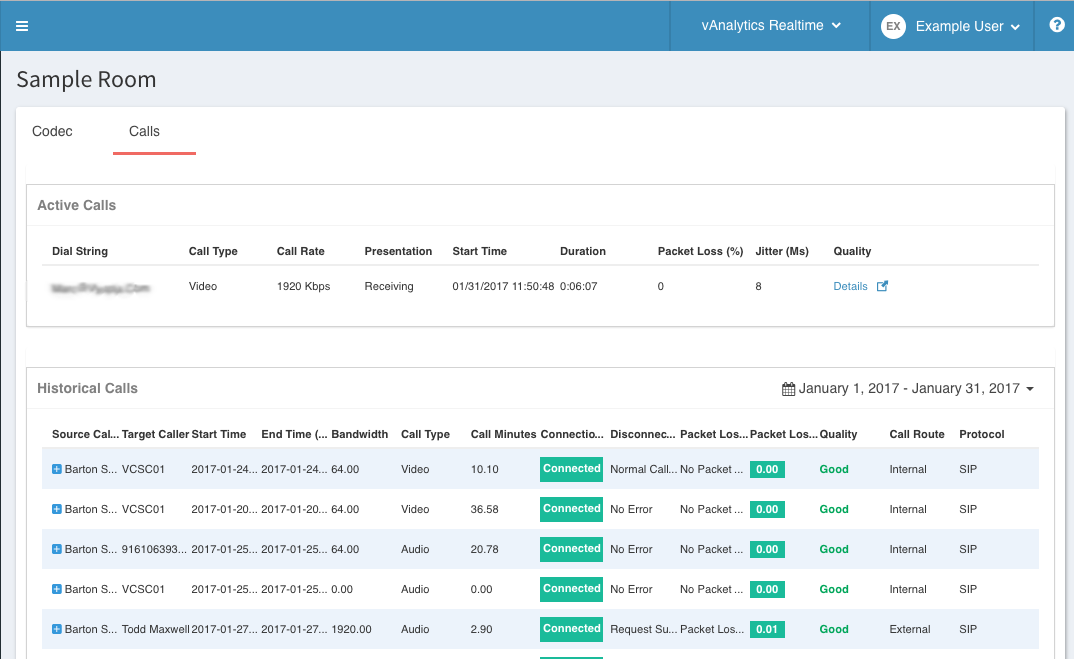
The endpoints in the Endpoint Status panels that are “In Call” and monitored by the new Vyopta Endpoint Monitor can be drilled into by clicking the endpoint name in question, then navigating to the Calls tab. As seen below, any Active Call will have a space at the top of that page where one can click the ![]() to drill into the endpoint’s call quality.
to drill into the endpoint’s call quality.
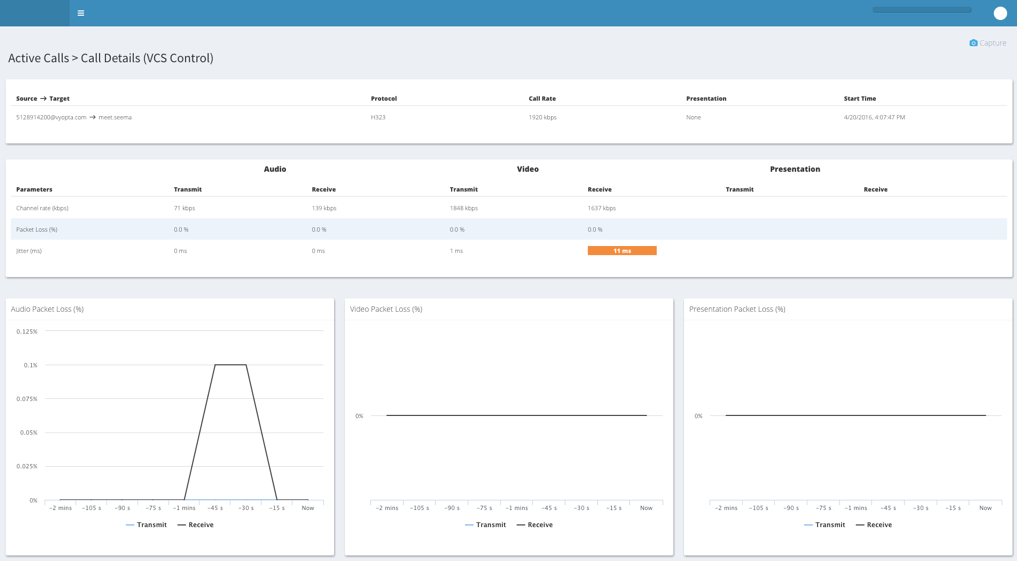
From this details view, you can see the following details:
- Dial String– displays the full dialing information of the participant(s)
- Participant name– the name of the endpoint/bridge on the call leg
- Call Time– time the call was connected
- Type– The type of call, audio or video
- Bit rate– the data rate, indicating resolution of call
- Presentation– whether or not a screen or application is being sent or received
- Packet Loss %– The percent of packets lost to total
- Jitter– Call jitter in milliseconds
Selecting the blue icon to the left of the endpoint name or clicking host address will open another browser tab and take you directly to the selected endpoints web access interface.
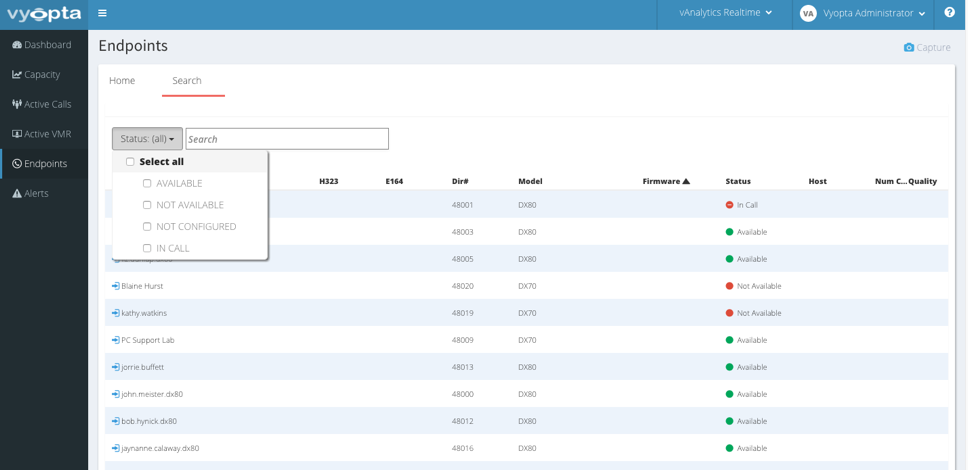
ENDPOINT SEARCH
At the top left of the Endpoint tab is a Search sub tab. Once selected you will be transferred to a list of all endpoints registered with vAnalytics. A search feature is available at the top that allows you to search either by status and/or name. This endpoint list does not automatically refresh when you have it open, and a refresh button has been provided to allow you to refresh the list (particularly for call status).